The proper insulin injection technique is an established factor in optimizing blood sugar control among diabetic patients. Several studies suggest that injection technique is of similar importance to the type and dose of insulin delivered to attain good glycemic control.1
Other factors that affect the pharmacokinetics/pharmacodynamics of insulin include: patient’s age, gender, body mass index (BMI), dose volume, insulin formulation, insulin antibodies and individual patient response differences, as well as variations in injection technique. Injection technique includes factors intended to facilitate the most consistent, least painful delivery of insulin into subcutaneous tissues (SC) and includes choice of injection site and needle length, angle of needle insertion and the use of lifted skin fold Errors in insulin injection technique curtails the ability of many patients to attain glycemic goals.2
The pharmacokinetic behavior of injected insulin varies with the nature of the tissue into which it is deposited, whether intradermal, or through fat, muscle or the peritoneal cavity, and is reflected in the different rates of appearance of insulin in the blood and ultimately, in blood glucose control. 3
Studies indicate that the absorption of insulin is altered in intramuscular injection compared to true subcutaneous placement. These provide evidence that if insulin is injected accidentally and intermittently into the muscle, this will contribute to day to day variability in the control of blood glucose. 3
Commonly used anatomical sites for SC insulin injections include the upper arm (triceps areas), antero-lateral upper thigh, abdomen (with the exception of a circle with a 2 inch radius around the navel) and the buttocks, typically the upper outer quadrant. Site selection should take into consideration the variable absorption between sites.
The difference in the rate of absorption at various anatomical sites is attributed to the number of blood capillaries and/or their permeability, as well as differing blood flow.4, 5
Ultrasound examination of the skin for experimental and clinical use has been recognized since the early 1990’s. In principle, the high frequency ultrasound wave (over 10 MHz) is emitted off from a transducer, becomes reflected in the skin from the interfaces between media of different acoustic properties, and returns back to the probe. The time lag between the emitted and the reflected signal enables the calculation of the distance between reflecting objects, whereas the amount of reflected energy characterizes the echogenicity of a given object.6
Two dimensional scanning, called B-mode scanning, is predominantly used, and in this mode, a two dimensional, cross sectional skin image is obtained. The first reflectant layer in the skin is the epidermis, the echogenicity of which depends mainly on the thickness of stratum corneum and the amount of air contained between the keratotic scales. Dermal echoes, however, are many and variable. Dermal echogenicity depends on the architecture of skin fiber network and on the amount of contained water. 6
The reproducibility of ultrasound technique for the determination of skin thickness was already investigated by Tan et al, as early as 1980.7 The study involved 2 independent observers who measured the skin thickness on the flexor aspect of both mid-forearms of 20 subjects. Each observer took five readings from each site. The study demonstrated that skin thickness measurement determined by ultrasound was highly reproducible with only small variability between observers.7
The thickness of SC tissues in the adult patient varies widely by gender, body site and body mass index, whereas the thickness of the skin (epidermis and dermis) is quite constant, averaging approximately 1.9-2.4 mm across injection sites, ages, races, BMI and gender; it is rarely >3.0 mm at injection sites for insulin.6 This was the same conclusion by Gibney et al., who conducted a study on the skin and subcutaneous layer thickness on 388 diabetic subjects, 16% of which were Asians living in the United States.2 To date, there is no published normative data on diabetic Filipinos living in the Philippines.
To determine the skin and subcutaneous thickness of adult Filipinos with diabetes mellitus using ultrasonography, and ascertain its implications for needle length recommendation.
1. To determine the average skin and subcutaneous thickness of adult Filipinos with diabetes mellitus using ultrasonography
2. To determine the effect on skin and subcutaneous tissue of factors such as body mass index, gender, age, injection site and insulin use
This is a cross-sectional analytic study. The study enrolled adult patients with diabetes mellitus from the outpatient department of the Section of Endocrinology, Diabetes and Metabolism. The measurements were conducted at the Diabetes, Thyroid and Endocrine Center from July 2012 to November 2012.
Participants of the study included: Adult patients (>19 years old), diagnosed with type 1 or type 2 diabetes mellitus. The following participants were excluded: Pregnant patients or those with any pathologic condition which might affect the distribution of or thickness of SC tissue such as: Cushing’s syndrome, generalized edema, soft tissue inflammation (at any site of measurement), and presence of ascites.
The following data were included in the study documentations: the subjects’ general information (e.g., name, age, sex) brief medical history: past illnesses, present illnesses, duration of diabetes and presence of complications as self reported by the patients as well as their current diabetes regimen). The subjects’ weight and height were measured on the day of sonographic measurement.
Ultrasound was selected to measure the skin thickness and subcutaneous thickness due to its utility, safety and reproducibility. The SonoSite M-Turbo portable ultrasound unit with a 13-6 MHz, 38 mm broadband linear array transducer probe (Sonosite Ltd.) was utilized for the study. A single ultrasound technician trained and skilled with the features and operation of the machine performed all the sonographic procedures to minimize operational bias. Ultrasound gel was applied, the probe was placed perpendicularly to the predetermined sites (see below). As necessary, the probe may be moved within areas of interest to obtain clear images. Skin thickness and subcutaneous thickness were measured. Three frames and measurement per site were made. The average of the three measurements were taken and used.
A radiosonologist independently reviewed the images for appraisal and verification of the images and values.
Skin and subcutaneous thickness at the common sites for insulin injection were measured. Specific locations for measurements based on bony and other superficial body landmarks were used to reduce inter-subject measurement variability. The skin and subcutaneous thickness was measured bilaterally with the exception of the abdominal area at the following sites:
a) Posterior upper arm: deltoid area, mid-distance between the acromion and olecranon processes
b) Anterior upper thigh: quadriceps area, mid-distance between the anterior superior iliac spine and the top edge of the patella
c) Anterior abdomen: mid-distance between the umbilicus and the anterior superior iliac spine
d) Upper buttocks: mid-distance between the inter-trochanteric spine and the tip of the coccyx
The ultrasound technician measured the sites following a specific sequence to reduce positional and technical variability: right upper arm, left upper arm, abdomen, right thigh, left thigh, left buttocks then finally right buttocks.
Sample size was estimated by the following: an estimated effect size (f2) of 0.15, with desired power of 80%, 6 predictors and probability level of 0.05. A minimum sample size of 97 was calculated. (123 if 90% power)
Descriptive statistics for skin thickness (ST) and subcutaneous adipose layer thickness (SCT) include graphical display, mean, median, standard deviation, minimum and maximum, and are provided for the entire population, and for each BMI subgroup and by gender. One way ANOVA with Bonferroni post hoc analysis was done to determine statistical difference in the mean ST and SCT by injection site. Multivariate analyses were done to better weigh the statistical and clinical impact of the various inputs such as injection site, gender, age, BMI and insulin use for both ST and SCT. The threshold for statistical significance is α = 0.05.
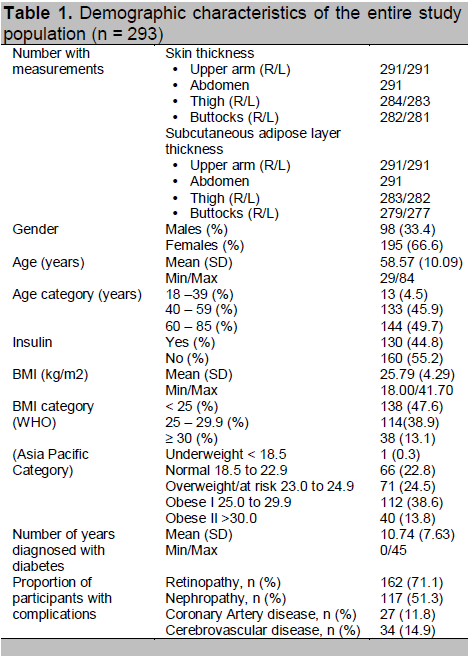
A total of 293 subjects participated in the study. Table 1 shows the demographic and clinical data of the subjects. Majority of the participants (67%) were females, with a mean age of 58.57 ± 10.09 years. Half of the participants were elderly, belonging to the 60 to 85 year old age group. Based on the WHO BMI category, almost half of the study population will fall within the normal BMI range (<25), 38% were overweight (BMI 25- 29.9), while 13% were obese. However, if we apply the Asia Pacific BMI classification for overweight and obesity, the majority of the patients will fall within the overweight and obese class I category (24.5% and 38.6% respectively). On average, study participants had been diagnosed with diabetes for 11 years.
In this study, ultrasound measurements for ST and/or for SCT were obtained for a total of 293 subjects. However, there were some participants with no ST and/or SCT measurement in some injection sites. These included patients who opted not to have their buttocks and thighs measured due to modesty and/or restrictive clothing. One subject was afflicted with polio and the investigators opted not to have his buttocks and thighs measured.
Table 3 shows the mean (SD) skin thickness by injection site. The results show that the thighs have the lowest mean skin thickness measurement at 1.76 mm while the buttocks have the highest mean skin thickness measurement at 2.75 mm. One way analysis of variance shows that there is a statistically significant difference in the mean skin thickness measurement between the different sites of injection. Bonferroni post hoc analysis showed that mean skin thickness measurement of the buttocks significantly differs from the mean skin thickness of the abdomen, arm, and thigh, while the mean skin thickness of the abdomen and the arm are not significantly different.
Click here to download Table 1
Table 1. Demographic characteristics of the entire study population (n = 293)
Click here to download Table 2
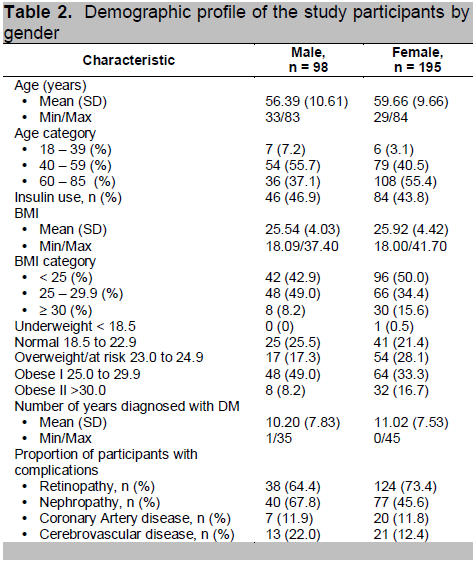
Table 2. Demographic profile of the study participants by gender
Click here to download Table 3
Table 3. Skin thickness (mm) by injection site
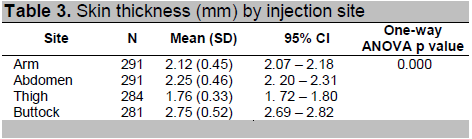
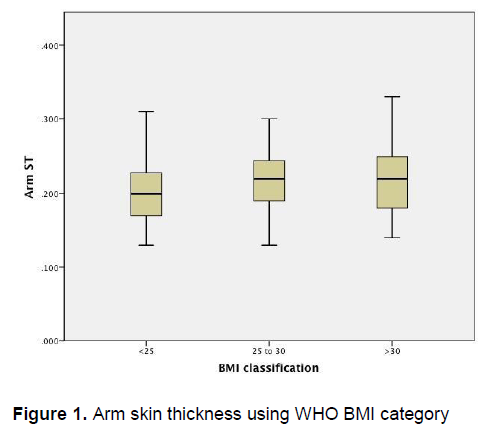
Figure 1 demonstrates that there is little variation in the arm skin thickness among patients of different BMI categories. Similarly, Figure 2 also demonstrates little variation in the skin thickness of the abdomen among these groups of patients.
Click here to download Figure 1
Figure 1. Arm skin thickness using WHO BMI category
Click here to download Figure 2
Figure 2. Abdomen skin thickness using WHO BMI category
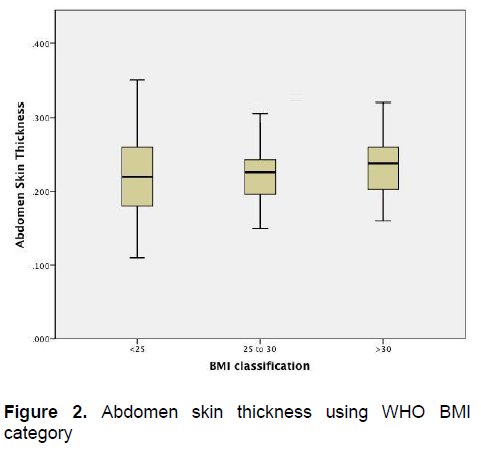
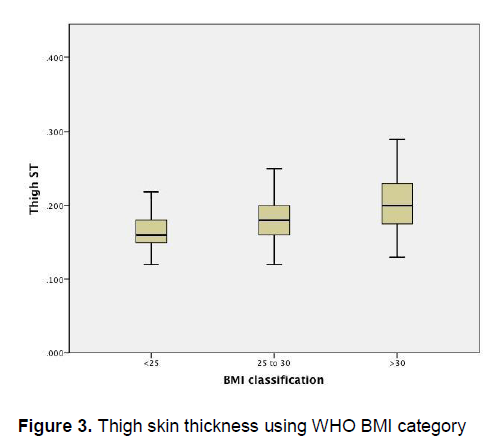
Figure 3 demonstrates an apparent trend of increasing thigh skin thickness as the BMI increases. On the other hand, Figure 4 demonstrates that there is little variation in the buttock skin thickness among patients of different BMI categories
Click here to download Figure 3
Figure 3. Thigh skin thickness using WHO BMI category
Click here to download Figure 4
Figure 4. Buttock skin thickness using WHO BMI category
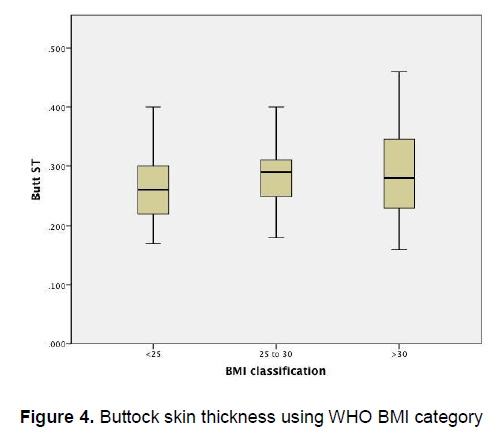
Table 4 shows the mean (SD) subcutaneous adipose layer thickness by injection site. It can be seen that the thighs have the lowest mean subcutaneous adipose layer measurement (6.91 ± 3.48mm), while the buttocks have the highest mean subcutaneous adipose layer thickness measurement at 12.91mm (5.42).
Click here to download Table 4
Table 4. Subcutaneous adipose layer thickness (mm) by injection site
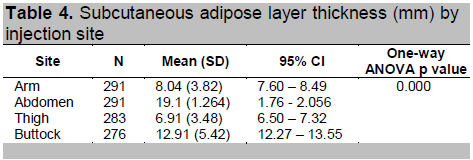
One way analysis of variance shows that there is a statistically significant difference in the mean SCT measurement according to site of injection. Bonferroni post hoc analysis showed that mean SCT measurement of the buttocks is significantly different from the mean skin thickness of the abdomen, arm, and thigh, while the mean SCT of the thigh and the arm are not significantly different.
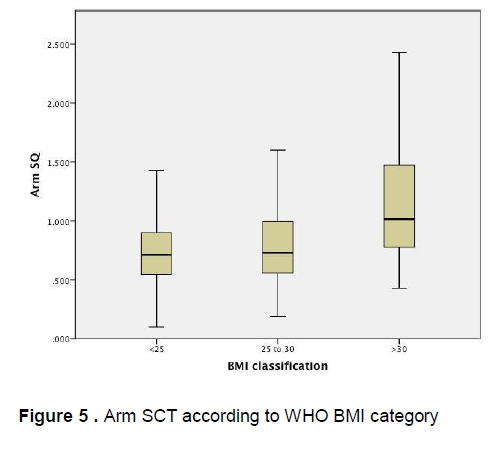
Figure 5 demonstrates that there is little variation in the mean arm subcutaneous adipose tissue thickness among patients of different BMI categories, however there is a wide confidence interval seen among obese patients . Similarly, Figure 6 demonstrates that there is little variation in the mean abdominal subcutaneous adipose tissue thickness among patients of different BMI categories, however a wide confidence interval is likewise seen among obese patients.
Click here to download Figure 5
Figure 5 . Arm SCT according to WHO BMI category
Click here to download Figure 6
Figure 6. Abdomen SCT according to WHO BMI category
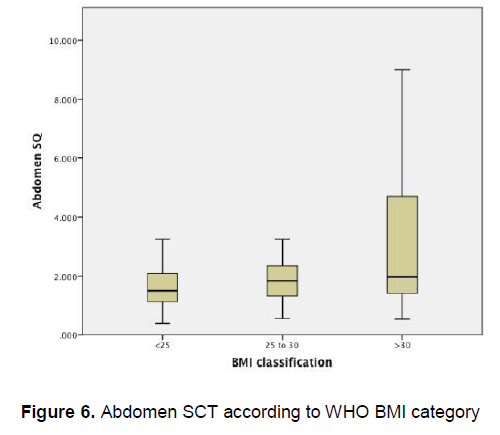
Figure 7 demonstrates that there is little variation in the mean thigh subcutaneous adipose tissue thickness among patients of different BMI categories, however a wider confidence interval is again seen among obese patients.
Click here to download Figure 7
Figure 7. Thigh SCT according to WHO BMI category
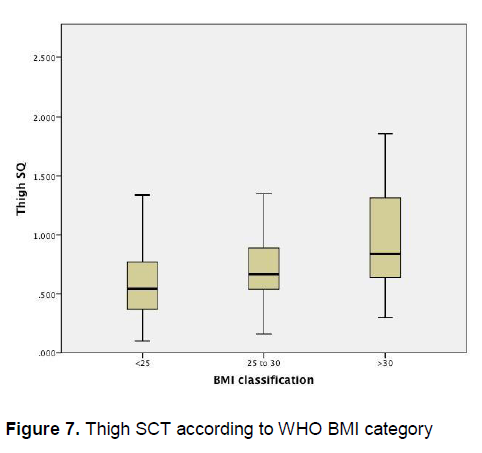
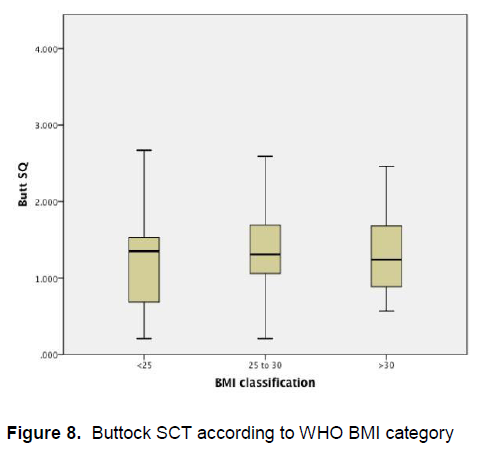
Figure 8 demonstrates that there is little variation in the mean buttocks subcutaneous adipose tissue thickness among patients of different BMI categories.
Click here to download Figure 8
Figure 8. Buttock SCT according to WHO BMI category
Utilizing multiple regression analysis to predict skin thickness, we included injection site as the main predictor variable, and injection site, age, gender, years diabetic, BMI, years diabetic and insulin use were considered as confounders. The final model (see Table 5) shows that all these variables are significant predictors of skin thickness. The adjusted R2 of 0.487 indicates that this model predicts 48.7% of the variance in skin thickness is due to the above model.
Click here to download Table5
Table 5. Multiple regression results for predicting skin thickness (final model)
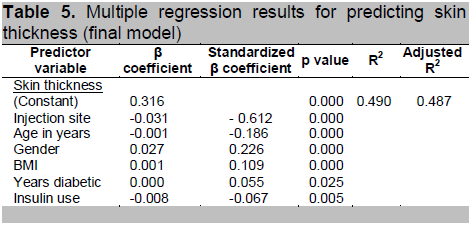
The remaining 51.3% is due to individual variation and might be explained by other factors that were not taken into account in the analysis or that the sample size is inadequate.
To determine the factors affecting subcutaneous thickness, we utilized multiple regression analysis and again included injection site as the main predictor variable, and injection site, age, gender, years diabetic, BMI, years diabetic and insulin use were considered as confounders. The final model (see Table 6) shows that the significant predictors of subcutaneous adipose layer thickness are injection site, age in years, BMI, and gender. Years diabetic and insulin use are not significant predictors of subcutaneous adipose layer thickness.
Click here to download Table 6
Table 6. Multiple regression results for predicting subcutaneous adipose layer thickness (final model)

The adusted R2 of 0.215 indicates that this model predicts 21.5% of the variance in subcutaneous adipose layer thickness. The injection site, age, gender, and years diabetic are the factors that account for this variance while remaining 78.5% is due to individual variation and might be explained by other factors that were not taken into account in the analysis. These include the effect of minute differences in hydration status, and use of lotion or emollients on the skin. This effect is expected to be small, especially if there is no overt sign of dehydration.
Most of the study participants live in urban areas with possibly more limited sun exposure compared to those living in the rural areas. The amount of sun exposure is a possible factor affecting skin thickness.7
Although use of insulin was taken into consideration, the duration of insulin use and the injection site preferred by the patient were not evaluated in this study.
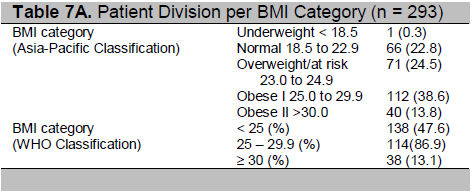
Using the Asia- Pacific BMI Classification (See Table 7A), an additional 114 patients will be classified as obese. These patients were classified as overweight under the WHO classification. In addition, 71 participants who were classified to have normal weight under WHO category, are overweight under the Asia Pacific Classification. The implications of this re-classification of participants are analyzed below.
Post hoc analysis using the Asia-Pacific BMI Classification
Click here to download Table 7A
Table 7A. Patient Division per BMI Category (n = 293)
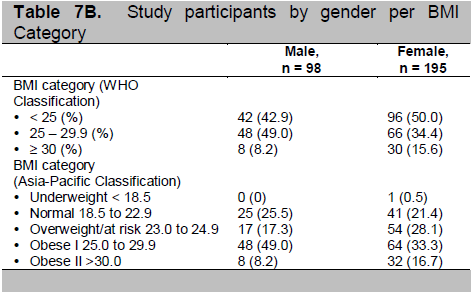
Click here to download Table 7B
Table 7B. Patient Division per BMI Category (n = 293)
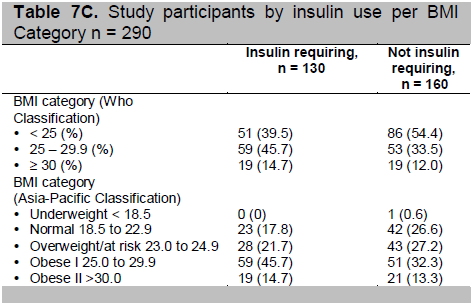
Click here to download Table 7C
Table 7C. Study participants by gender per BMI Category
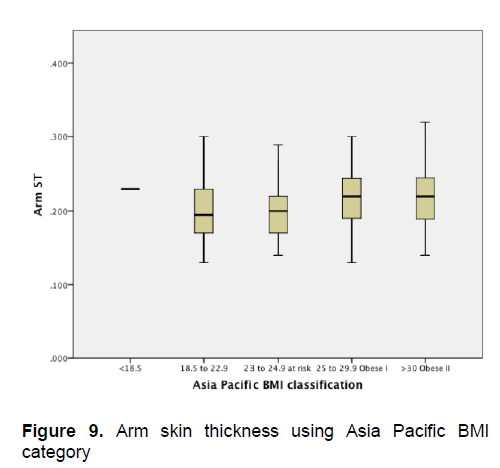
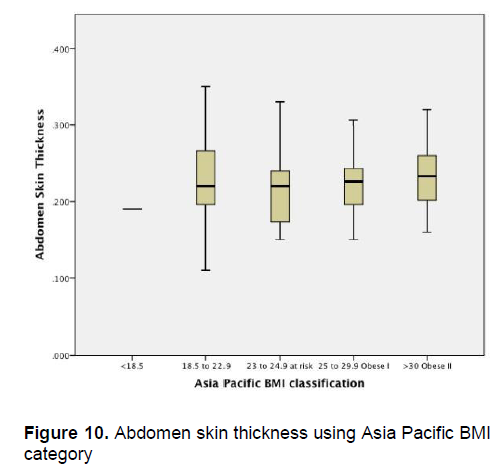
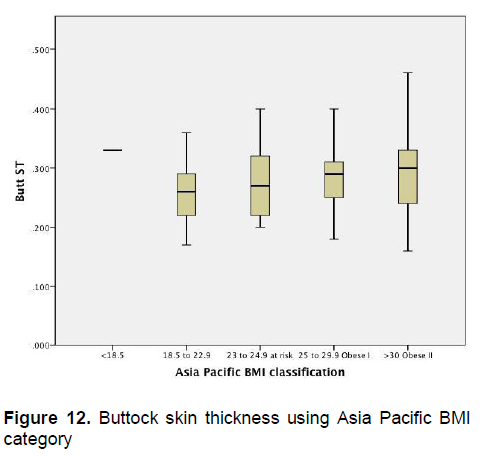
Figures 1-4 show the mean skin thickness of participants per BMI category based on the WHO Category. While Figures 9-12 show the mean skin thickness of participants per BMI category based on the Asia Pacific classification. When these figures were compared side-by-side, no significant difference can be clearly demonstrated. In both analysis, little variation in skin thickness is seen among the participants of the different BMI category, whether they were groups based on the WHO or Asia-Pacific Classification.
Click here to download Figure 9
Figure 9. Arm skin thickness using Asia Pacific BMI category
Click here to download Figure 10
Figure 10. Abdomen skin thickness using Asia Pacific BMI category
Click here to download Figure 11
Figure 11. Thigh skin thickness using Asia Pacific BMI category

Click here to download Figure 12
Figure 12. Buttock skin thickness using Asia Pacific BMI category
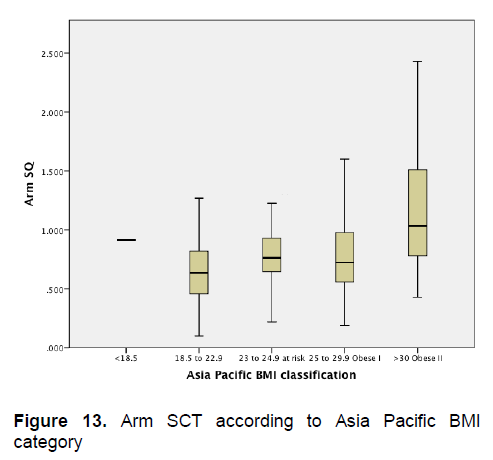
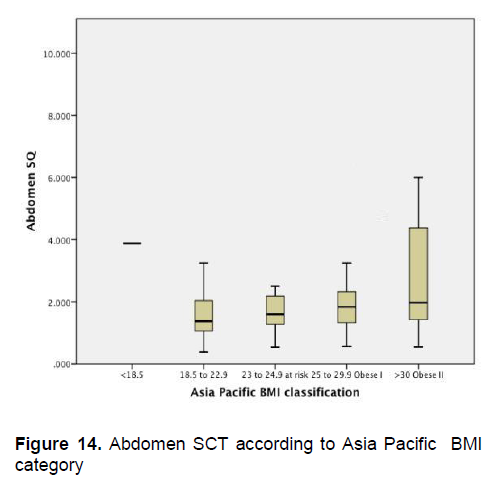
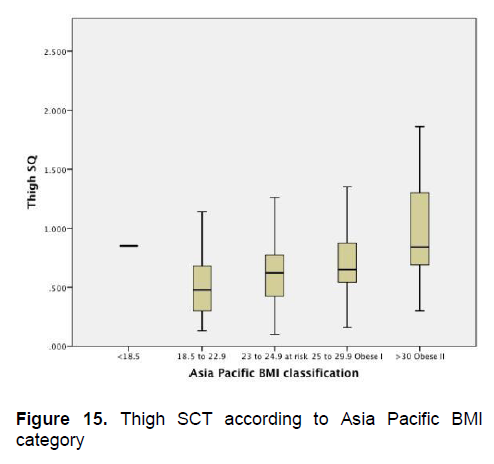
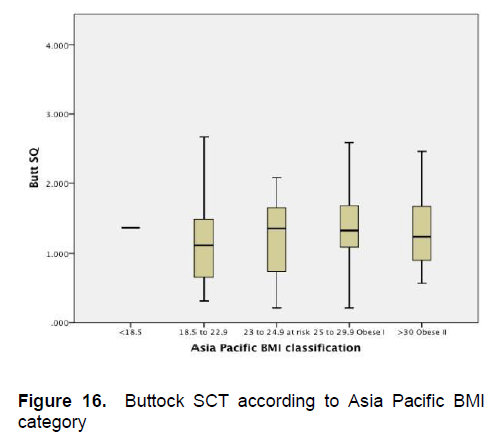
Figures 5-8 show the mean subcutaneous thickness of participants per BMI category based on the WHO Category while Figures 13-16 show the mean subcutaneous thickness of participants per BMI category based on the Asia Pacific guidelines. When these figures were compared side-by-side, no significant difference can be clearly demonstrated. In both analysis, little variation in subcutaneous thickness is seen among the participants of different BMI category, whether they were groups based on the WHO or Asia-Pacific Classification.
Click here to download Figure 13
Figure 13. Arm SCT according to Asia Pacific BMI category
Click here to download Figure 14
Figure 14. Abdomen SCT according to Asia Pacific BMI category
Click here to download Figure 15
Figure 15. Thigh SCT according to Asia Pacific BMI category
Click here to download Figure 16
Figure 16. Buttock SCT according to Asia Pacific BMI category
Insulin can ameliorate many of the metabolic abnormalities in diabetes. Insulin therapy is shrouded by firmly held fallacies and myths, especially among less informed patients. The primary resistance to insulin therapy is the stigma of an injectable maintenance medication. A visual demonstration of short insulin needles will allay most of the patient’s fears, especially of the pain and discomfort accompanying the injection.
The American Diabetes Association recognizes the influence of needle length on glycemic control and has recommended that physicians and patients note variability in blood sugars when changing from one needle length to another.
Several studies have undertaken to measure skin and subcutaneous adipose layer thickness by ultrasound to establish the appropriate needle length for insulin injections while minimizing the risk of intramuscular injection.2,3 It is established that the skin thickness varies considerably within and between different anatomical areas. Variations in skin thickness according to age, ethnic origin, gender and body site were factors investigated that influence effective insulin delivery. Most of these studies indicate that skin thickness is very consistent across subjects with diverse demographic features.
Similarly, subcutaneous adipose tissue varies considerably and is affected by particular characteristics such as body site, body mass index and gender. The skin thickness in our study across body sites and BMI categories ranged from 1.7 to 2.699 mm. These values are similar to the findings of other races involving Caucasians. 2,3
Similar to other findings, the thigh has the thinnest mean lower bound 95% CI at 1.7 mm and the thickest mean upper bound 95% CI was 2.69 mm in the buttocks. 2,3
Gibney demonstrated in his study of 388 diabetic adults in the United States that the mean skin thickness for the common insulin injection sites ranged from 1.9 mm to 2.44 mm, with the thinnest thickness at the thigh and the buttocks being the thickest among the measurements. Mean subcutaneous measurement for this series ranged from 10.4 mm to 15.4 mm at the thighs.7
Gibney’s findings were comparable with Laurent, who conducted a normative study of the skin thickness among non-diabetic subjects among three ethnic groups, including Asians. Measurements that would correspond to insulin injection sites were skin thickness at the level of the waist was 1.91 mm and 1.55 mm in the thigh.2, 10
Lee and Hwang in 2001 studied 452 Korean patients and measured 28 different sites including: abdomen (site # 10), buttocks (site #13), back of the arm (site # 16), and front of the thigh (site # 21). In this study, the authors noted that among females the buttocks measured 1.728 mm, the abdomen 1.225 mm, the posterior arm was 1.351 mm and the front of the thigh was 1.077 mm. Among males, the skin thickness in the abdomen was 1.43mm, the buttocks measured 1.678 mm, the back of the arm and the front of the thigh measured 1.0 mm and 1.162 mm respectively.11
This study demonstrated relatively similar skin thickness measurements across increasing BMI categories. Subcutaneous measurement differences across BMI categories were more marked. The greatest skin thickness measurement of 2.82 mm in the buttock area supports the recommendation that short needles are appropriate and safe for diabetic Filipinos on insulin therapy. The average measurements at the injections sites are as follows: posterior arm 2.12 mm, anterior thigh 1.76 mm, abdomen 2.25 mm and buttocks 2.75 mm also indicate that short needles (4 mm, 5 mm) are sufficient to adequately penetrate the skin and deliver insulin to the subcutaneous layer. This would also minimize inadvertent intramuscular injection.
Skin thickness among Filipinos varies minimally depending on injection site, being thickest at the buttocks and thinnest at the thigh area. On the other hand, there is greater variability in subcutaneous tissue depending on the injection site, being thickest at the abdominal area and thinnest at the anterior thigh.
The study was limited to diabetic patients seen at the OPD during the duration of the study period and certain subgroups of patients (e.g., <40 year old, type 1 DM, those with low or normal BMI) were not well represented in this analysis
Technical support and use of the ultrasound machine was provided by Becton, Dickinson and Company
1. Strauss K, Insulin injection techniques. Report from the 1st international insulin injection technique workshop. Practical Diabetes International. 2005;15(6)181-184.
2. Gibney M, Arce A, Byron K, Hirsch L. Skin and subcutaneous adipose layer thickness in adults with diabetes at sites used for insulin injections: Implication for needle length recommendations. Current Medical Research & Opinion.2010; 26(6):1519-1530
3. Lo Presti D, Ingegnosi C, Strauss K. Skin and subcutaneous thickness at injecting sites in children with diabetes: Ultrasound findings and recommendations for giving injection. Pediatr Diabetes 2012;13: 525–533. doi: 10.1111/j.1399-5448.2012.00865.
4. Siminerio L, Kulkarni K, Meece J, Cypresse M. Strategies for insulin injection therapy in diabetes self management. American Association of Diabetes Educators. 2011/ http://www.diabeteseducator.org/ export/sites/aade/_resources.
5. Hansen B. Evidence based clinical guidelines for injection of insulin for adults with diabetes mellitus. Danish Nurses Organization. 2006. http://www.dsr.dk/Artikler/Documents/English/Evidence based_clinical_guidelines_for_injection .
6. Gniadecka M, et al. Skin ultrasonography – Clinical implications and experimental applications. The Gulf Journal of Dermatology. 1995;2(2):27-31.
7. Tan CY. Skin thickness measurement by pulsed ultrasound: its reproducibility, validation and variability. British Journal of Dermatology. 1982; 106, 657-667.
8. Waller Jeanette. Age and skin structure and function, a quantitative approach: Blood flow, ph, thickness and ultrasound echogenicity. Skin Research and Technology 2005; 11: 227-235
9. Frid A, Hirsch L, Gaspar D, Kreugel G. New injection recommendation for patients with diabetes. Diabetes and Metabolism. 2010;36:S3-S1.
10. Laurent A, et al. Echographic measurement of skin thickness in adults by high frequency ultrasound to assess the appropriate microneedle length for intradermal delivery of vaccines. Vaccine. 2007;25(34):6423-30.
11. Lee Y and Hwang K. Skin thickness of Korean adults. Surgical Radiology Anatomy. Springer Verlag. 2002;24(3-4):183-9.
Articles and any other material published in the JAFES represent the work of the author(s) and should not be construed to reflect the opinions of the Editors or the Publisher.
Authors are required to accomplish, sign and submit scanned copies of the JAFES Declaration that the article represents original material that is not being considered for publication or has not been published or accepted for publication elsewhere.
Consent forms, as appropriate, have been secured for the publication of information about patients; otherwise, authors declared that all means have been exhausted for securing such consent.
The authors have signed disclosures that there are no financial or other relationships that might lead to a conflict of interest. All authors are required to submit Authorship Certifications that the manuscript has been read and approved by all authors, and that the requirements for authorship have been met by each author.