Non-alcoholic fatty liver disease (NAFLD), metabolic syndrome and type 2 diabetes mellitus (DM) coexist because they share the same risk factors. Obesity, insulin resistance and increased plasma fatty acid concentrations are considered to increase the risk for fatty liver, and each of these metabolic factors is also characteristic of type 2 DM.1 On the other hand, NAFLD may be considered an additional feature of the metabolic syndrome, with specific hepatic insulin resistance,2 while metabolic syndrome has been extensively associated with the development of steatosis as well as liver damage in NAFLD.3 The incidence of NAFLD and fibrosis progression, including hepatocellular carcinoma, has been found to be significantly higher in diabetic patients compared with non-diabetic patients.4,5 Hence, the diagnosis and evaluation of fatty liver is an important component of the management of diabetes.
Currently, there are no tests which have a high degree of accuracy for detecting or screening fatty liver. Ultrasonography (US) is the most common method for screening asymptomatic patients with suspected NAFLD because it is easy to perform and relatively inexpensive, has been found to have sensitivity and specificity ranging from 60 to 95% and 84 to 100% respectively, but these decrease in the setting of mild steatosis affecting less than 30% of the hepatocytes.6 Moreover, although mildly elevated serum aminotransferase levels are the primary abnormality seen in patients with NAFLD, liver enzymes may be normal in up to 78% of patients with NAFLD.7 Poynard and colleagues reported that an ALT >50 IU/L has a sensitivity and specificity of only 72% and 62%, respectively, thus, they suggested a lower cut off value.8 In another study, the prevalence of elevated ALT in those with type 2 diabetes mellitus was 7.8% compared to 3.8% prevalence in those without diabetes.9
A new ultrasonic technique - elastography (fibroscan), is being used in the assessment of fatty liver. In a study by Yin-Yan, et al., involving 105 patients with mild, moderate and severe fatty liver (n= 46, 39, and 20, respectively) and 45 healthy controls, ultrasonic elastography was found to have a sensitivity of 97.14% and a specificity of 91.11% when compared with traditional ultrasound.10 However, the study did not compare the results with a gold standard. Also, there was no mention of whether the patients had diabetes or metabolic syndrome.Thus, the aim of this study is to compare the sensitivity and specificity of the elastography (Fibroscan) versus traditional ultrasound and elevated aminotransferases in detecting fatty liver and fibrosis among patients with diabetes and metabolic syndrome, using NAFLD fibrosis score as the surrogate gold standard marker for liver fibrosis. This is a simple noninvasive scoring system composed of routinely measured and easily available clinical and laboratory variables which has been found to be accurate in distinguishing the severity of fibrosis.11 This study also seeks to determine the association between glycemic control and lipid profile values with fibrosis score.
The was a cross-sectional comparative study covering adult patients diagnosed with metabolic syndrome and diabetes mellitus type 2 at a private, tertiary medical center.
All elastography results from January to December 2013 (n=506) were reviewed along with patient charts containing clinical data, but only those patients diagnosed with metabolic syndrome and type 2 diabetes mellitus were included in this study.
Metabolic syndrome as defined by the International Diabetes Federation (IDF) is central obesity plus any two of the following four factors:12
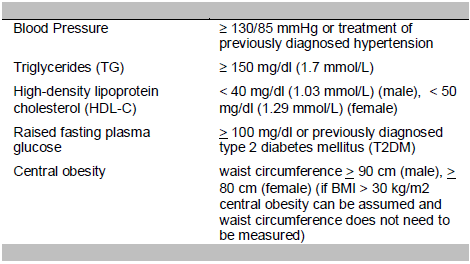
Patients with type 1 diabetes mellitus, known alcoholics, those with any form of liver disease and those on medications for fatty liver, dyslipidemia (statins, fibric acid, bile acid sequestrants or thiazolidinediones) or elevated liver enzymes (phospholipids, silymarin, omega-3-fatty acids, carnitine, amino acid, vitamin B) were excluded. Patients aged less than 18 years were also excluded because the NAFLD fibrosis score was validated in subjects 18 years old and above.
The final number of patients included, based on the inclusion/exclusion criteria, was 102. A sample size of 80 was computed based on 90% power with assumed area under the curve for association between ultrasound and elastograph for a higher level of ALT of 0.61 (obtained from previous studies) versus assumed 80% area under the curve for the association between ultrasound and fibroscan with lower levels of ALT.
The following patient data were obtained retrospectively from records: age, sex, BMI, waist circumference, blood pressure, ALT and AST results, lipid profile (cholesterol, triglycerides, LDL and HDL), FBS, HbA1C, platelet count, albumin, and results of ultrasound and elastography. Laboratory tests, ultrasound and fibroscan were done within 1 month of each other. Fibroscan and ultrasound were both done on the patients as requested by their own private physicians.
The NAFLD fibrosis score was computed and used as a surrogate gold standard. The formula used is as follows: 12
Fibrosis Score = −1.675 + 0.037 – age (years) + 0.094 – BMI (kg/m2) + 1.13 × IFG/diabetes (yes = 1, no = 0) + 0.99 × AST/ALT ratio – 0.013 × platelet count (×109/l) – 0.66 × albumin (g/dl)
A fibrosis score < -1.455 corresponds to F0 to F2 stages in the METAVIR scoring system.13 A score of -1.455 to 0.675 is an indeterminate score while a score > 0.675 corresponds to stages F3 to F4. Liver fibrosis stages according to the METAVIR scoring system are described as follows:

The sensitivity and specificity of elastograph, ultrasound, ALT and AST were computed with fibrosis score as surrogate gold standard. Sensitivity and specificity of the elastograph and ultrasound were then compared using z-test for proportions. The correlation of glycemic control, lipid profile and fibrosis score were determined using chi square test with a level of significance at 0.05. Computations were performed using SPSS for Windows version 22.
Table 1 summarizes the clinical profile of the patients. The 102 patients had ages ranging from 20 to 76 years with a mean age of 51.27 years old. More than half are males, obese class 1 by Asia-Pacific classification, with increased waist circumference and dyslipidemic. Majority are hypertensive with metabolic syndrome.
Click here to download Table 1
Table 1. Characteristics of the patient population

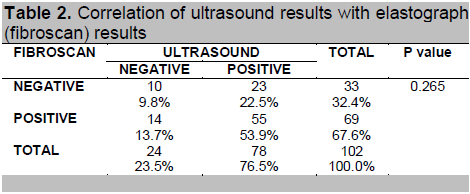
Table 2 shows no significant association between ultrasound and elastograph (fibroscan) findings (p-value = 0.265). The ultrasound and fibroscan had the same results in only 63.7% of the cases (53.9% both positive and 9.8% both negative results). Twenty-three (23) of the 78 positives based on ultrasound were negative based on fibroscan.
Click here to download Table2
Table 2. Correlation of ultrasound results with elastograph (fibroscan) results
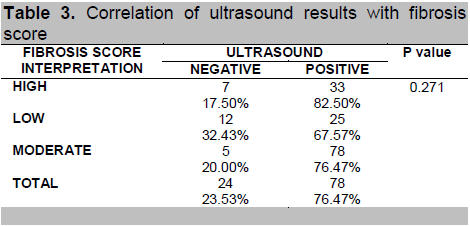
The ultrasound findings and elastograph (fibroscan) findings were also compared with the fibrosis score (Tables 3 and 4, respectively). Ultrasound results were not found to be significantly correlated with fibrosis score (p-value = 0.271) but fibroscan results were (p-value = 0.000).
Click here to download Table 3
Table 3. Correlation of ultrasound results with fibrosis score
Click here to download Table 4
Table 4. Correlation of elastograph (fibroscan) results with fibrosis score

Moreover, elastography was found to be more sensitive compared to ultrasound (100% vs 82.5%, p = 0.0036) for patients with diabetes and metabolic syndrome who have a high probability of fibrosis and 96% vs 76.4% (p-value = 0.0036) for patients with moderate probability for fibrosis. The elastograph is also more specific compared to the ultrasound (86.49% vs 32.43%, p-value = 0.0000) for detecting fatty liver and fibrosis.
Table 5 shows the correlation of the liver function tests and fibrosis score. An AST level greater than 35 U/L has a sensitivity of only 32.5% for detecting fatty liver and fibrosis in patients with a high probability of fibrosis and 40% for patients with moderate probability. It has a 64.86% specificity. ALT level greater than 35 U/L has a sensitivity of 65% for detecting fatty liver and fibrosis in patients with a high probability and 56% for patients with moderate probability. It has a 45.95% specificity.
Click here to download Table 5
Table 5. Correlation of ALT and AST with fibrosis score

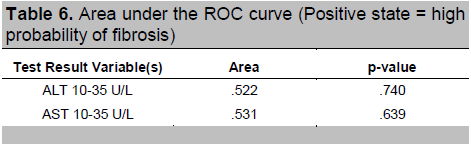
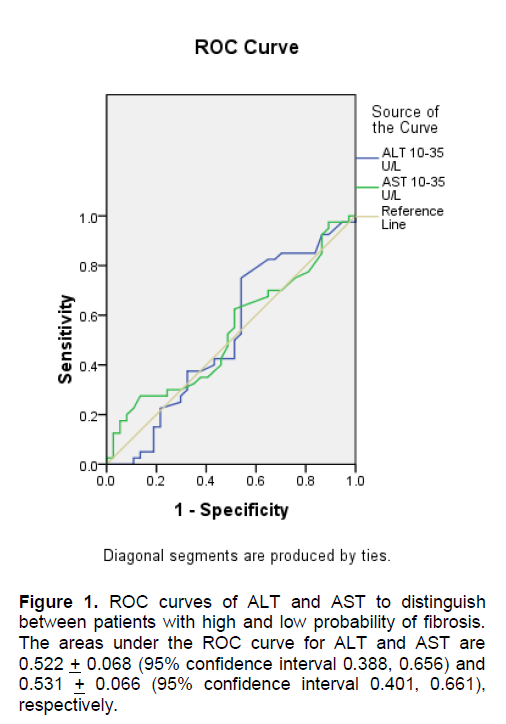
To find out which level of AST and ALT had the best predictive value, an ROC curve analysis was done. The rule of thumb states that the further the curve lies above the reference line, the more accurate the test. However, Figures 1 and 2 show that the curves for AST and ALT are very close to the reference line, implying that the tests do not accurately predict the positive actual state (positive state = high fibrosis score for Figure 1 and moderate fibrosis score for Figure 2). Moreover, Tables 6 and 7 show that the areas under the curve, which represents the probability that the ALT and AST results for a randomly chosen positive case will exceed the results for a randomly chosen negative case, are only slightly higher than 0.5 with p-values > 0.05, implying that using ALT or AST to predict NAFLD is not significantly different from guessing. This indicates that no coordinates of the curve could be used as basis for cut-offs that will result in the best sensitivity and specificity.
Click here to download Table 6
Table 6. Area under the ROC curve (Positive state = high probability of fibrosis)
Click here to download Figure 1
Figure 1. ROC curves of ALT and AST to distinguish between patients with high and low probability of fibrosis. The areas under the ROC curve for ALT and AST are 0.522 + 0.068 (95% confidence interval 0.388, 0.656) and 0.531 + 0.066 (95% confidence interval 0.401, 0.661), respectively.
Click here to download Figure 2
Figure 2. ROC curves of ALT and AST to distinguish between patients with moderate and low probability of fibrosis.The areas under the ROC curve for ALT and AST are 0.585 + 0.075 (95% confidence interval 0.438, 0.733) and 0.605 + 0.076 (95% confidence interval 0.457, 0.753), respectively.

Click here to download Table 7
Table 7. Area under the ROC curve (Positive state = moderate probability of fibrosis)
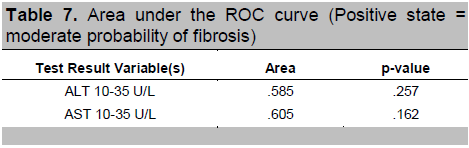
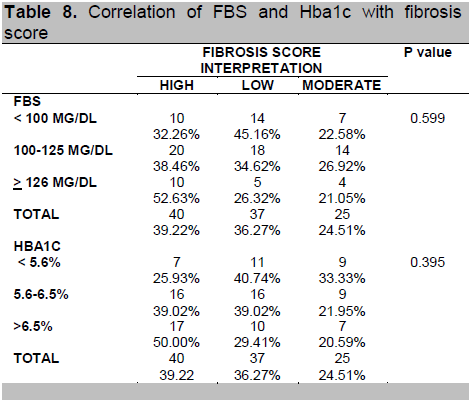
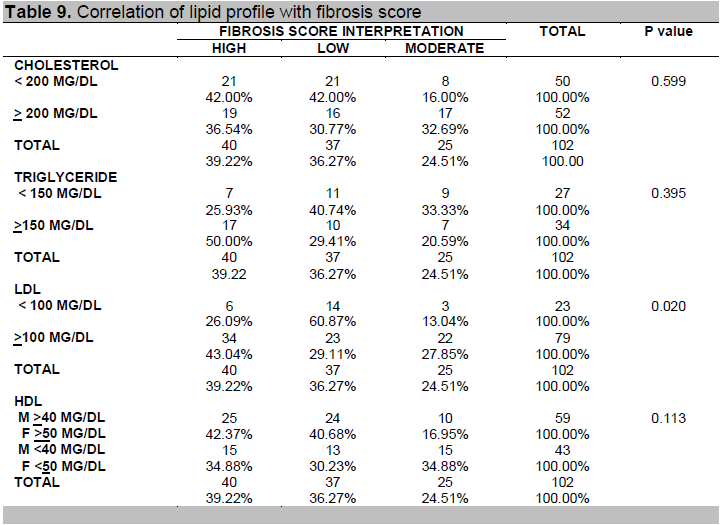
Table 8 shows that FBS and HbA1C were not significantly associated with fibrosis score while Table 9 shows that among the components of lipid profile, only LDL was found to be significantly associated with fibrosis score (p-value = 0.020).
Click here to download Table 8
Table 8. Correlation of FBS and Hba1c with fibrosis score
Click here to download Table 9
Table 9. Correlation of lipid profile with fibrosis score
This study showed that when ultrasound and elastography results were compared to the surrogate gold standard (fibrosis score) for diagnosing fatty liver and fibrosis, elastography was more sensitive and specific. The basic principle of elastography relies on the application of dynamic or static/semi-static stimulation from an intrinsic (including autonomous) or extrinsic source of tissues. Under physical regulation of elastic mechanics and biomechanics, tissues would generate a strain as a response to relocation, reactions, and possibly a certain change in the speed, which is shown as a disturbance in distribution. Therefore, ultrasonic elastography can obtain quantitative information on distributions of elasticity in tissues.11
This study also showed that both ALT and AST are not good markers for fatty liver and fibrosis among patients with type 2 DM and metabolic syndrome. Even though the primary laboratory abnormalities in NAFLD are elevated serum AST and ALT levels; they are seldom higher than 3 or 4 times the upper limit of normal. Changes of aminotransferases do not parallel changes in fibrosis stage. In a study by Somaye et al., in which they classified patients to have normal or elevated ALT levels using a cut-off value of 35U/L, it was found that by decreasing the normal value, there was no significant difference between patients with NAFLD according to their pathologic findings except for ballooning of hepatocytes, which is a minor finding compared to more frequent presentations such as fibrosis.14 But in another study by Paschos, et al., it has been suggested that the normal limits for ALT values should be revised and lowered.15,16 The decrease of the upper limits of normal for ALT level from 40 U/L to 30 U/L in men and from 30 U/L to 19 U/L in women increases the sensitivity for detection of patients with liver injury from 55% to 76% but decreases the specificity from 97% to 88%. This study used an AST and ALT cut-off of 35 U/L which still indicated low sensitivity and specificity for detecting NAFLD and fibrosis.10
FBS and HbA1C were not significantly associated with fibrosis score in this study. This may be attributed to the fact that the development of NAFLD is associated with insulin resistance. This may occur even in the presence of normoglycemia.16,17
Excess glycogen accumulation in the liver is seen in 80% of diabetic patients regardless of sugar levels.18 The finding of glycogen nuclei in a patient with fatty liver is useful confirmatory evidence that the fatty liver is secondary to diabetes even if the glucose tolerance test is normal. Sandhya et al., showed that it was the oxidative stress found in insulin resistance and diabetes that contribute to the development of fatty liver and fibrosis.19
When lipid profile was compared to the presence of fatty liver and fibrosis, only elevated LDL levels showed a correlation with the fibrosis score. An elevated LDL level (greater than 100 mg/dl) makes the likelihood of fatty liver and fibrosis greater. The consistent positive correlation of LDL levels with imaging studies may be because it is found to be the most atherogenic.15 Previously, serum triglyceride levels were also thought to be elevated in fatty liver but recent findings showed that the hallmark of NAFDL is excessive accumulation of triglycerides in the liver, but not necessarily in the blood.19
The main limitation of this study is that the true gold standard (liver biopsy) was not done for the patients included in this study. Liver biopsy is an invasive procedure with associated costs, complications and inherent inaccuracy due to sampling error and inter- and intraobserver variability in histopathological interpretation.11,20
Elastograph (fibroscan) is more sensitive and specific than traditional ultrasound in detecting fatty liver in the presence of severe and moderate probability for fibrosis. Ultrasound, ALT and AST showed no correlation with fibrosis score.
1. Kelley DE, McKolanis TM, Hegazi RAF, Kuller LH and Kalhan SC. Fatty liver in type 2 diabetes mellitus: relation to regional adiposity, fatty acids, and insulin resistance. Am J Physiol Endocrinol Metab. 2003;285: E906–E916.
2. Marchesini G, et al. Nonalcoholic fatty liver disease a feature of the metabolic syndrome. Diabetes 50.8 2001: 1844-1850. 3. Wieckowska A and Feldstein AE. Diagnosis of nonalcoholic fatty liver disease: Invasive versus noninvasive. Seminars in Liver Disease. 2008; 28(4):386–395. 4. Garcia-Compean DK, et al. Liver cirrhosis and diabetes: Risk factors, pathophysiology, clinical implications and management. World Journal of Gastroenterology. 2009; 42-56. 5. Adams LA, Sanderson S, Lindor KD, Angulo P. The histological course of nonalcoholic fatty liver disease: A longitudinal study of 103 patients with sequential liver biopsies. Journal of Hepatology. 2005; 42:132–138. 6. Myers RP, et al. Noninvasive diagnosis of nonalcoholic fatty liver disease. Annals of Hepatology 2009; 8(1): S25-S33 7. Adams LA and Angulo P. Recent concepts in non‐alcoholic fatty liver disease. Diabetic Medicine. 2005; 22(9): 1129-1133. 8. Poynard T, et al. The diagnostic value of biomarkers for the prediction of liver steatosis. Comp Hepatology. 2005; 4:10 9. Erbey JR, Silberman C, Lydick E. Prevalence of abnormal serum alanine amino transferase level in obese patients and patients with type 2 diabetes. American Journal of Medicine, 2000 November; 109(7)588-590. 10. Yin-Yan L, Xue-Mei W, et al. Ultrasonic elastography in clinical quantitative assessment of fatty liver. World Journal of Gastroenterology. 2010; 12-25. 11. Angulo P, et al. The NAFLD fibrosis score: A noninvasive system that identifies liver fibrosis in patients with NAFLD. Journal of Hepatology. 2007; 45(4): 846-54 12. Consensus worldwide definition of metabolic syndrome. http//:www.idf.org/webdata/docs/IDF_Meta_def_final.pdf. Accessed September 10, 2012. 13. Foucher J, et al. Diagnosis of cirrhosis by transient elastography (fibroscan): A prospective study. GUT. 2006; 124-156. 14. Somaye K, et al. Non-alcoholic fatty liver disease and correlation of serum alanine aminotransferase level with histopathologic findings. Hepatitis Monthly. 2011; 11(6): 452-458 15. Paschos P, Paletas K. Non-alcoholic fatty liver disease and metabolic syndrome. Hippokratia. 2009; 13(1): 9-19. 16. Prati D, Taioli E, Zanella E. Updated definitions of healthy ranges for serum alanine transferase levels. Ann. Med. Int. 2002; 137:1-1. 17. Smith BW, Adams LA. Nonalcoholic fatty liver disease and diabetes mellitus: Pathogenesis and treatment. Nature Reviews Endocrinology. 2011; 7(8):456-465. 18. Levinthal G and Tavill A. Liver disease and diabetes mellitus. Clinical Diabetes. 2010; 498-532. 19. Oikawa S, Fon Tracer K, Rozman D. Nonalcoholic fatty liver disease: Focus on lipoprotein and lipid deregulation. Journal of Lipids. 2011; 28(4):339-350. 20. Demir M, Lang S, Schlattjan M, Drebber U, Wedemeyer I, et al. NIKEI: A new inexpensive and non-invasive scoring system to exclude advanced fibrosis in patients with NAFLD. PLoS ONE 8(3): 2013: e58360. doi:10.1371/journal.pone.0058360Articles and any other material published in the JAFES represent the work of the author(s) and should not be construed to reflect the opinions of the Editors or the Publisher.
Authors are required to accomplish, sign and submit scanned copies of the JAFES Declaration that the article represents original material that is not being considered for publication or has not been published or accepted for publication elsewhere.
Consent forms, as appropriate, have been secured for the publication of information about patients; otherwise, authors declared that all means have been exhausted for securing such consent.
The authors have signed disclosures that there are no financial or other relationships that might lead to a conflict of interest. All authors are required to submit Authorship Certifications that the manuscript has been read and approved by all authors, and that the requirements for authorship have been met by each author.