Foo Siew Hui, MBBS, MRCP
Fellowship in Endocrinology
Clinical Endocrinologist
University Malaya Medical Centre
Lembah Pantai, 59100, Kuala Lumpur, Malaysia
Tel No.: 603-79494422
Fax No.: 603-79562253
E-mai.:jsiewhui@yahoo.com
e-ISSN 2308-118x
Printed in the Philippines
Copyright © 2011 by the JAFES
Received May 26, 2011. Accepted October 5, 2011.
Objectives. To examine the profile of insulin resistance and secretory dysfunction and their relationship with clinical/metabolic parameters among patients with newly diagnosed type 2 diabetes mellitus in Malaysia.
Methods. A cross-sectional study of 161 newly diagnosed type 2 diabetic subjects was performed. Fasting blood samples were collected for glucose, insulin and biochemistry. Demographic and anthropometric data were recorded. Homeostatic model assessment (HOMA) was used to estimate insulin resistance (IR) and beta-cell function. Control subjects consist of 45 individuals with normal glucose tolerance.
Results. Our type 2 diabetic subjects had significantly higher HOMA-IR and lower HOMA-%B versus controls (6.4 &plumn; 5.3 vs. 2.5 ± 1.5, p < 0.0001 and 93.5 ± 87.8% vs. 201.0 ± 118.0%, p < 0.0001). Elevated body mass index or waist circumference, hypertension and hypertriglyceridaemia were independent predictors for insulin resistance. Low body mass index or waist circumference, hypertriglyceridaemia and increasing age were independent predictors for beta cell dysfunction.
Conclusions. Contrary to a predominantly insulin secretory dysfunction reported by other studies from Asia, our study of largely overweight and obese type 2 diabetic subjects showed a predominance of insulin resistance over secretory dysfunction. Obesity, hypertension and hypertriglyceridaemia were predictive of insulin resistance while being lean with hypertriglyceridaemia and increasing age were predictive of beta cell dysfunction.
Keywords: type 2 diabetes mellitus; insulin resistance; insulin secretory dysfunction; obesity.
Both insulin resistance (IR) and insulin secretory dysfunction have been implicated in the pathogenesis of type 2 diabetes mellitus (T2DM). The relative contribution of each varies among individuals of different ethnic or genetic backgrounds. In the Pima Indians and Mexican Americans, insulin resistance is believed to be the primary defect 1. In comparison, findings from several studies on Asian type 2 diabetic subjects indicate that insulin secretory dysfunction plays a more dominant role 1-3. This is a pilot study on the relative contribution of insulin secretory dysfunction and insulin resistance among a group of type 2 diabetic individuals in Malaysia. The clinical parameters that have been found to be associated with insulin resistance include regional adiposity, dyslipidemia, hypertension, microalbuminuria and smoking 4-8. There is very little data on clinical parameters associated with insulin secretory dysfunction.
The objectives of this study are to examine the profile of insulin resistance and insulin secretory dysfunction as well as the clinical/metabolic parameters that predict insulin resistance and secretory dysfunction among newly diagnosed T2DM subjects in Malaysia.
This is a dual center, comparative cross-sectional study. All diabetic subjects were recruited from the primary care clinics which provide universal health care at University of Malaya Medical Centre, Kuala Lumpur and the Hospital of University of Science, Kota Bharu. Both were university hospitals which provide tertiary health care service to the western and northern region of Malaysia respectively. All patients with newly diagnosed, drug-naive T2DM from the primary care clinics were recruited consecutively from March to November 2008. Newly diagnosed T2DM was defined as a diagnosis of T2DM made within six months prior to study inclusion. The diagnosis of diabetes mellitus was made either by the usual fasting or random venous plasma glucose or after undergoing a 75g oral glucose tolerance test based on the 1998 World Health Organisation's criteria 10. Diabetic subjects who were below 20 years of age, taking medications that can affect glucose tolerance, diagnosed with type 1 diabetes or pregnant were excluded. Control subjects were recruited from healthy volunteers from the local community. They were required to have a normal oral glucose tolerance test without a positive family history in a first degree relative with T2DM. Attempts were made in order to match the controls to the diabetic subjects in terms of gender distribution, age, ethnicity and body weight. Informed consent was obtained according to the protocols approved by the ethics committees of University of Malaya Medical Centre and the Hospital of University of Science.
A complete medical history, physical examination, collection of anthropometric and demographic data was performed in all diabetic and control subjects. Waist circumference (WC) was measured at the midpoint between the lower costal margin and the iliac crest according to the World Health Organisation's recommendation. For T2DM subjects, venous blood was obtained for fasting plasma glucose (FPG), fasting plasma insulin (FPI), lipid profile, glycated haemoglobin (HbA1c) and anti-glutamic acid decarboxylase (anti-GAD) after an overnight fast of 12 hours while a freshly void midstream spot urine sample was collected for microalbumin and creatinine estimation. Anti-GAD was performed to screen out any type 1 diabetic subjects who may be misclassified as type 2 diabetes. Blood pressure was measured in sitting position after the subjects rested for five minutes for three consecutive readings. The systolic and diastolic blood pressure was derived from an average of the three readings respectively. Mean arterial pressure (MAP) was calculated as the sum of the diastolic blood pressure and one third of the pulse pressure. For control subjects, oral glucose tolerance was performed with 75 g glucose after an overnight fast. We obtained FPI along with FPG before the glucose challenge.
Plasma glucose was measured with the hexokinase method (Siemens Dimension RXL). The intra- and inter-assay coefficients of variation were 0.7 and 1.3 % respectively. Plasma insulin was measured with immunoassay (Cobas) with an intra and inter-assay coefficients of variation of 1.5-2 % and 2.1-2.8 % respectively. This assay does not have significant cross-reactivity with proinsulin. The same assay and laboratory was used for the measurement of plasma insulin for all the diabetic and control subjects at the same time. The plasma triglyceride (TG) and high-density lipoprotein (HDL) cholesterol levels were measured with selective detergent and glycerol kinase method (Siemens Dimension RXL) respectively. HbA1c was performed using the high performance liquid chromatography (Bio-rad) while anti GAD was performed with enzyme-linked immunosorbent assay (Euroimmun). The urine microalbumin and creatinine was performed with immunoturbidmetry method (Roche Lobas Integra 800).
Insulin resistance and pancreatic beta cell function was calculated using the Homeostatic Model Assessment (HOMA) proposed by Matthews et al (10). The formulas are:
Insulin resistance, HOMA-IR = FPI (μU/ml) x FPG (mmol/L) / 22.5
Beta cell function, HOMA-%B = 20 x FPI (μU/ml) / [FPG (mmol/L) - 3.5]
Numerical values were expressed as means &plusm; standard deviations. Statistical analysis was conducted using the Statistical Package for Social Science (SPSS) version 15. Group means were compared using Student's t-test or Analysis of Variance (ANOVA) where appropriate followed by post-hoc analysis (Tamhane's or Scheffe's). Homogeneity of variances was assessed using the Levene's test. Where the variances were homogenous, Scheffe's post-hoc test was used while Tamhane's test was used when the variances were not homogenous. Pearson's chi-square test was used to test categorical variables between diabetic subjects and controls. Correlation coefficients (r) between HOMA-IR and HOMA-%B with various clinical parameters were calculated using Pearson's correlation. Several stepwise multiple regression analyses that included HOMA-IR, HOMA-%B, age, gender, ethnicity, MAP, body mass index (BMI) or WC, smoking status, urine microalbumin, plasma TG and HDL cholesterol were performed to examine the relative contribution of HOMA-IR and HOMA-%B towards HbA1c, i.e. glycaemic intolerance. Several regression models that included age, gender, ethnicity, BMI, WC, plasma TG and HDL cholesterol, MAP, urine microalbumin and smoking status were also performed to examine the independent relationship between the various clinical or metabolic predictor variables with HOMA-IR and HOMA-%B. To provide a measure of the independent effect of each variable in the model, we report the percent change in R2 (i.e. the difference between the R2 from models with and without the variable of interest, divided by the R2 from the model with the variable). As BMI and WC were highly correlated (r=0.846), they were included in separate models. A p value of < 0.05 was considered statistically significant.
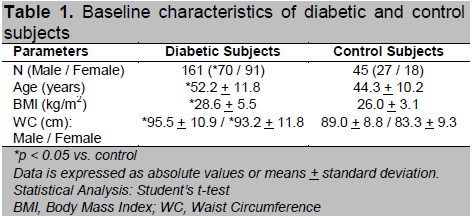
A total of 161 diabetic subjects aged 25-81 years were recruited, 60.9 % being Malay, 19.9 % Chinese, 18.6 % Indian and 0.6% others. Majority (74.5%) of the diabetic subjects were diagnosed via routine screening when they visited the primary care clinics for other conditions associated with diabetes, e.g. hypertension and dyslipidaemia, and they were diagnosed by two FPG of > 7 mmol/L (41%) or by oral glucose tolerance test (33.5%) when the FPG is impaired as defined by > 5.6 mmol/L. Only 25.5% of the diabetic subjects presented with symptomatic hyperglycaemia with a random plasma glucose of > 11.1 mmol/L upon diagnosis. Of note is that the majority of the diabetic subjects were overweight/obese with a mean BMI of 28.6 + 5.5 kg/m2. More than half, 85 (52.8 %) of them were obese (BMI > 27.5) while 59 (36.6 %) were overweight (BMI 23-27.5) as defined by the National Clinical Practice Guidelines on Management of Obesity of Malaysia (11). Using the Asian cut off point of 90 cm for male and 80 cm for female for central obesity, 121 (75.2 %) of the diabetic subjects were centrally obese (12). A total of 93 subjects (57.8 %) had positive family history of T2DM in first-degree relatives and 99 (61.5 %) were hypertensive (defined by a blood pressure of > 130 mmHg systolic and or > 85 mmHg diastolic or were on antihypertensive medications). Dyslipidaemia, defined as fasting serum triglyceride (TG)3 1.7 mmol/L or high-density lipoprotein (HDL) cholesterol < 1.04 mmol/L in male and 1.30 mmol/L in female was present in 100 (62.1 %) of the diabetic subjects. A total of 45 control subjects aged 25-72 years old were also recruited concurrently from healthy volunteers. Of these, 24 (53.3%) were overweight while 14 (31.1%) were obese. The baseline characteristics of the diabetic and control subjects are summarized in Table 1.
Click here to download Table 1
Table 1. Baseline characteristics of diabetic and control subjects
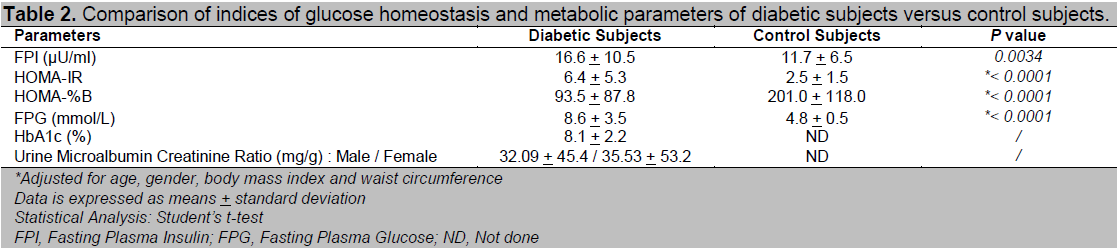
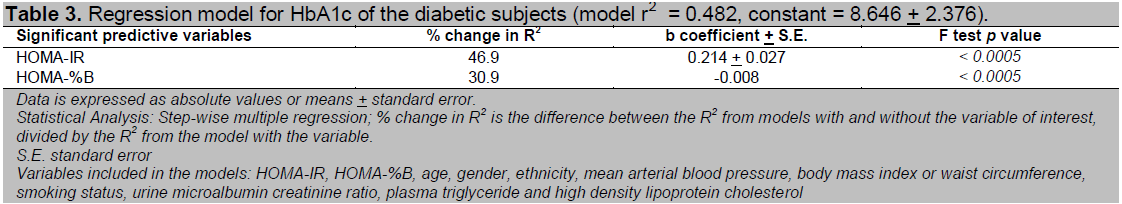
Table 2 shows the comparison of HOMA-IR, HOMA-%B and other metabolic parameters between the diabetic and control subjects. As expected, the newly diagnosed diabetic subjects had significantly more severe insulin resistance as well as beta cell dysfunction compared to the controls, even after adjustment for difference in age, gender, BMI and WC. HOMA-IR increased 2.6 times while HOMA-%B was reduced by 53.5% among the diabetic subjects compared to the controls. There was a wide variation of insulin resistance as well as beta-cell function among the newly diagnosed diabetic subjects. HOMA-IR ranged from 0.87 to 28.56 while HOMA-%B ranged from 3.2 to 568.0. In the regression model for HbA1c in the newly diagnosed diabetic subjects, there was a predominance of contribution of insulin resistance towards glycaemic intolerance or HbA1c over beta cell dysfunction as indicated by a higher percent change in R 2 values for HOMA-IR (46.3 %) versus HOMA-%B (30.4 %) (Table 3).
Click here to download Figure 1
Figure 1 Relationship between a) HOMA-IR and b) HOMA-%B and obesity among newly diagnosed diabetic subjects.
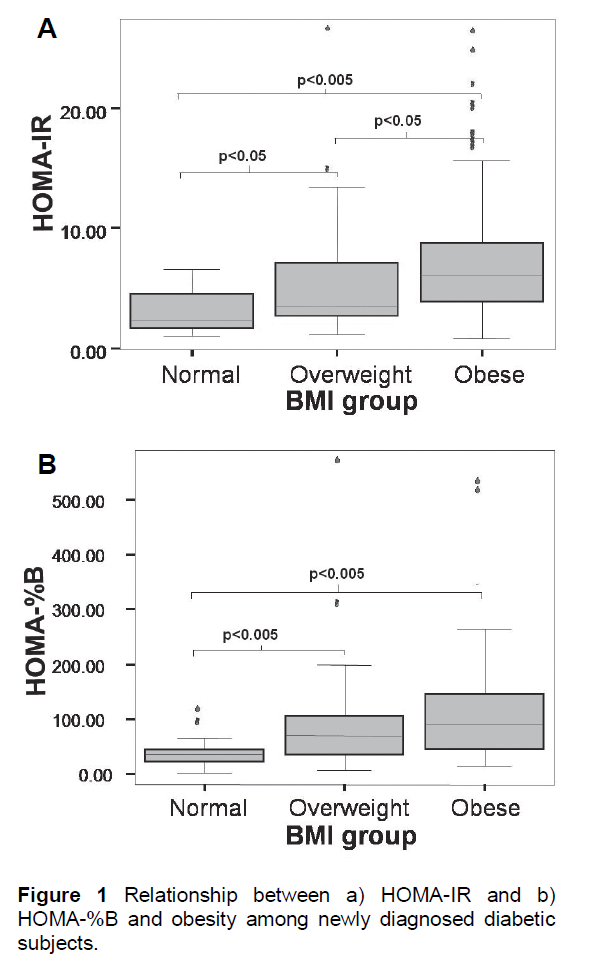
a) HOMA-IR (with the extreme outlier in the normal weight group excluded)
b) HOMA-%B
- Upper and lower borders of the box indicate the 1st and 3rd quartile values while the line in the middle indicates median. The unfilled circles are suspected outliers (> 1.5 x IQR above the 3rd quartile) while the * were outliers (> 3 x IQR above the 3rd quartile).
- BMI, Body Mass Index; IQR, Interquartile range
A significant relationship was found between HOMA-IR and HOMA-%B with obesity among the diabetic subjects as shown in Figure 1. The obese diabetic subjects were significantly more insulin resistant than the overweight diabetic subjects. The differences between the obese or overweight versus the normal weight diabetic subjects were statistically significant when an extreme outlier in the normal weight group was excluded (Figure 1a). This particular individual presented with a FPG of 20 mmol/L with HOMA-IR of 28.56 and HOMA-%B of only 37.28%. This individual was probably a case of late diagnosis of advanced T2DM or latent autoimmune diabetes. Beta cell dysfunction was significantly more pronounced among the normal weight compared to the overweight or obese diabetic subjects. No significant difference in beta cell function was demonstrated between the overweight and obese group (Figure 1b). These relationships were also demonstrated by the significant correlations between HOMA-IR and HOMA-%B with BMI (r = 0.351, p < 0.005 for HOMA-IR; r = 0.266, p = 0.001 for HOMA-%B).
Click here to download Table2
Table 2. Comparison of indices of glucose homeostasis and metabolic parameters of diabetic subjects versus control subjects.
Click here to download Table 3
Table 3. Regression model for HbA1c of the diabetic subjects (model r2 = 0.482, constant = 8.646 + 2.376).
Click here to download Table 4
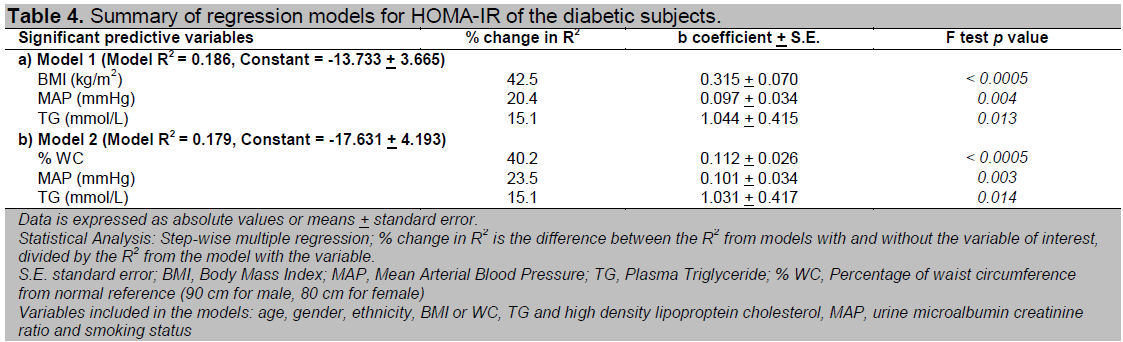
Table 4. Summary of regression models for HOMA-IR of the diabetic subjects.
Click here to download Table 5
Table 5. Summary of regression models for HOMA-%B of the diabetic subjects.
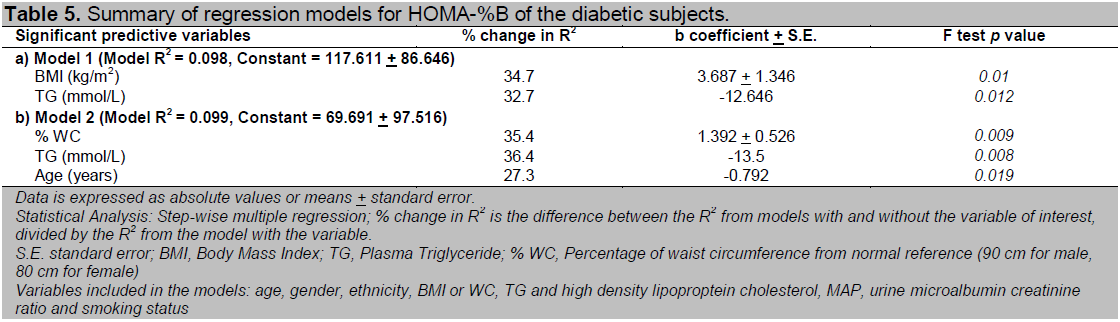
Multivariate analysis conducted to look for independent clinical predictors of HOMA-IR and HOMA-%B among our newly diagnosed T2DM subjects revealed that a raised BMI, WC, MAP and TG were independent risk factors for insulin resistance while a raised TG, a low BMI or WC and increasing age were independent risk factors for beta cell dysfunction (Table 4 and 5). All the non-anthropometric parameters were significant in both models that include BMI and WC respectively (Model 1 and 2) except age which was only significant in the model that included WC for HOMA-%B.
The percent change in R2 for both BMI and WC were very similar for prediction of both HOMA-IR and HOMA-%B (Table 4 and 5). This implies that neither parameter held a significant advantage over the other in prediction of insulin resistance or beta cell dysfunction. In the subgroup analysis of obese and non-obese diabetic subjects, we found that a raised BMI, WC and TG appeared to play a more important role among the obese diabetic subjects while MAP was only important among the non-obese diabetic subjects in prediction of insulin resistance. Additionally, we also found that having a low HDL were independent risk factors for insulin resistance among the non-obese diabetic subjects (data not shown).
The mean HOMA-IR among our newly diagnosed diabetic subjects in this study was 6.4. This is much higher than those reported in other studies from the Asian region, with values ranging from 2.4-3.5 1-3, 6, 13. Our result is more comparable to that of an Italian study with a reported mean HOMA-IR of 5.9 14. Similarly, the mean HOMA-%B among our newly diagnosed diabetic subjects was 93.5 %, which is much higher than other studies from the Asian region, with values ranging from 32.4-34.0 % 2, 13. Our Malaysian data is more comparable to the Insulin Resistance Atherosclerosis Study cohorts in United States of America which reported a mean HOMA-%B of 117.0 %.15 Despite being part of Asia, the newly diagnosed T2DM subjects in our study appeared to be more insulin resistant than those from other parts of Asia. This is most probably related to the relatively higher BMI in our study subjects compared to that reported from other studies from this region. The mean BMI of the diabetic subjects in our study is 28.6 kg/m2, which is comparable to the mean BMI of diabetic subjects reported in the Western countries (28.8-29.6 kg/m2) but is significantly higher than those reported in other studies in the Asian region (21.8-25.5 kg/m2) 2, 3, 13-17.
All of our diabetic subjects were recruited from urban areas. Urbanisation results in transition from a traditional to a westernised lifestyle characterised by a high fat diet and lack of physical activity. According to the theory of a 'thrifty genotype,' Asians exposed to a Western lifestyle are more predisposed to insulin resistance due to their increased ability to store fat, i.e. they are 'metabolically obese.' 2, 16, 18 Although a wide range of insulin resistance and insulin secretory dysfunction was found among our diabetic subjects, insulin resistance contributes more than beta cell dysfunction towards the severity of glycaemic intolerance. Our study's findings differ from that reported from the other studies in the Asian region that suggest insulin secretory dysfunction is the primary defect of T2DM among Asians 1-3. This is best explained by the largely overweight or obese population of type 2 diabetes in our study with a mean BMI of 28.6 kg/m2 as opposed to the much leaner population with a mean BMI of 21.8-25.3 kg/m2 in the other studies in the Asian region. Numerous studies have shown that obesity is strongly associated with insulin resistance 5, 19-22.
Comparing insulin resistance across different degrees of obesity, a direct relationship is observed between insulin resistance across categories of obesity, i.e. obese, overweight and normal when the extreme outlier in the normal weight group was excluded from the analysis. Similar observations have been reported in previous studies 5, 19-21.
We found that both overall and central obesity as measured by BMI and WC were equally predictive of insulin resistance among our newly diagnosed diabetic subjects as indicated by their similar values in percent change in R2. Similar findings were noted in Molist-Brunet's and Farin's study23,24. BMI has been demonstrated to be an important correlate of subcutaneous fat while WC, an important correlate for visceral fat 25, 26. Taniguchi and Wagenknect et al found that both subcutaneous and visceral fat to be predictive of insulin resistance 5-7, 27. However, there seems to be ethnic differences in the relationship of regional adiposity with insulin resistance. Abate et al found that subcutaneous fat but not intra or retroperitoneal fat was associated with insulin resistance in non-Hispanic whites with T2DM 19. Banerji and Gautier et al demonstrated a strong relationship between insulin sensitivity with visceral but not general adiposity in the black and French populations respectively 20, 21. On the other hand, Kelley et al observed an independent association of insulin resistance with deep subcutaneous abdominal fat over and above that of visceral fat but not superficial subcutaneous abdominal fat among Americans 28.
For our non-obese diabetic subjects, neither BMI nor WC had an independent effect on insulin resistance. Taniguchi et al also found an absence of predictive effect of BMI on insulin resistance among the non-obese diabetic patients in Japan. It was felt that hypertriglyceridemia was more important in that study 5, 6. However, a raised blood pressure and low HDL seemed to be the more important predictors of insulin resistance among our non-obese diabetic subjects. Our results concur with that of Laakso et al who demonstrated a significant relationship between hypertension and insulin resistance in lean but not obese type 2 diabetic subjects 29.
In the multivariate analysis, WC did not seem to confer any obvious superiority over BMI in prediction of insulin resistance as postulated for Asians with T2DM who are generally centrally obese with relatively lower BMI 16, 22, 30. This is probably because of the relatively high proportion of obese diabetic subjects in our study. Only 24.8% of our diabetic subjects had BMI below 25 kg/m2. Hypertriglyceridaemia was found to be a significant predictor for both insulin resistance and beta cell dysfunction among our diabetic subjects. This is consistent with the finding that serum TG as a predictor of progression in glucose intolerance in a longitudinal study done in Malaysia 31. Hypertriglyceridaemia was also found to be associated with insulin resistance in a few other studies 5-7, 32. The other clinical parameters that had been associated with insulin resistance in previous studies include HDL cholesterol, microalbuminuria and smoking. A significant relationship between urine microalbuminuria and insulin resistance was not reproduced in our study. HDL was only significant as a predictor of insulin resistance among the non-obese diabetic subjects. Although blood pressure was one of the independent predictors of insulin resistance, its correlation was weaker than expected. The associations of all these parameters with insulin resistance were probably confounded by the fact that more than half of our diabetic subjects were already on lipid lowering or anti-hypertensive therapy including angiotensin converting enzyme inhibitors or angiotensin receptor blockers at the time of the study.
The relationship between beta cell dysfunction and obesity is less straightforward. BMI seemed to play a more prominent role only among the diabetic subjects with normal weight. Once a diabetic subject became overweight or obese, there was no difference in the degree of beta cell dysfunction. As a result, the bivariate analysis between BMI with HOMA-IR and HOMA-%B revealed a weaker correlation for the latter as only 10.4% of our diabetic subjects were of normal weight. In the multivariate analysis, a raised plasma TG, a low BMI or WC and increasing age were independent predictors of beta cell dysfunction. Age was only significant in the model that included WC but not in the model that included BMI. This is probably due to a significant interaction between BMI and age. When the regression model was adjusted for BMI, the effect of age on beta cell function became insignificant. There have been no published studies so far that examines the relationship of various clinical parameters with beta cell dysfunction in diabetic subjects. The mechanisms underlying the relationship between adiposity and insulin secretion are unclear and are further complicated by the effect of co-existing insulin resistance on beta cell function. Increased peripheral insulin levels with development of insulin resistance associated with obesity could be falsely interpreted as increased insulin secretion. BMI did not confer any obvious supremacy over WC in predicting beta cell dysfunction among our diabetic subjects. This can be explained by the relative inaccuracy of anthropometric indices in distinguishing subcutaneous from visceral abdominal fat compared to computed tomography, the modalities used by Wagenknect et al 27. The direct effect of lipotoxicity associated with hypertryglyceridaemia on beta cell function may explain the direct relationship between TG and beta cell dysfunction.
There were a few limitations in our study. All the subjects were recruited from two government tertiary health institutions in Kuala Lumpur and Kota Bharu located in urban areas which provide subsidised health care service to the people with limited access to private health care. This limits the generalisability of our findings to the general population in Malaysia. The small sample size also does not allow subgroup analysis especially on the effects on ethnicity. The control subjects selected were slightly younger and less obese than the diabetic counterparts despite attempts made to have these parameters matched during recruitment. Nevertheless, the differences in all parameters compared between the diabetic and control group remained significant after adjustment for age, gender, BMI and WC. We chose the HOMA method proposed by Matthew et al in assessing insulin resistance and beta cell function 12. Although it is an indirect measurement, it provides an estimation that correlates well with the glucose clamp in subjects with varying degree of glucose tolerance12. It measures the basal rather than the stimulated state and has the tendency of overestimation of beta cell function15,33. The HOMA-%B values must therefore be interpreted together with the concurrent HOMA-IR. It is technically simple and inexpensive, favouring its use in an epidemiological setting. We did not assess the visceral or subcutaneous abdominal fat directly but used WC and BMI as surrogate measures. BMI and WC are imperfect measures of regional distribution of adiposity, a major determinant of insulin resistance as they do not distinguish visceral from subcutaneous adiposity34. A high correlation of 0.85 was found between BMI and WC in our study. This implies that there might be a significant overlap in the type of fat measured by these two surrogates. Previous studies demonstrated that BMI was positively correlated with both subcutaneous and visceral fat5,27. BMI also compounds body fat with muscle and skeletal mass making it an imprecise surrogate for overall obesity34. A larger sample size with more representation from the rural areas, different ethnic groups as well as a wider range of BMI would also be ideal to generate adequate statistical power to detect differences between subgroups.
The prevalence of diabetes mellitus in Malaysia has increased drastically over the past two decades from 6.3 % in 1986 to 8.2 % in 1996 and 14.9 % in 2006 35. Our T2DM subjects recruited from two university hospitals in Malaysia who are largely overweight or obese, behaved more closely to T2DM individuals from the West, with a predominance of insulin resistance over secretory dysfunction rather than a primarily insulin secretory defect contrary to results from other studies from Asia, conducted on subjects with lower BMI. The mean HOMA-IR and HOMA-%B of our type 2 diabetic subjects were more comparable to those of the Caucasians rather than Asian counterparts. It is important in terms of therapeutic strategy for physicians to consider the pathophysiologic processes determining T2DM, i.e. the relative contribution of insulin resistance and impaired insulin secretion. Based on the results of our study, an obese diabetic subject with hypertension and hypertriglyceridemia is likely to be insulin resistant while a lean diabetic subject with raised plasma TG and increasing age is likely to be insulin deficient. However, co-existing insulin resistance should be suspected if this lean diabetic subject also has hypertension with a low HDL level. Nevertheless, these results need to be verified in a bigger study sample of subjects more representative of the general Malaysian population.
We would like to acknowledge the following individuals for their contributions to this study:
1 Professor Chaicharn Deerochanawong; 1Pattraporn Konthong; 2Dr Ng Mee Lian; 2Maria Chai; 3Dr Wan Zahiruddin Wan Mohammad, 3Lee Siau Siau
1 Diabetes Unit, Rajavithi Hospital, Thailand
2 Clinical Investigation Centre, University of Malaya Medical Centre, Malaysia
3 Clinical Trial Unit, School of Medical Sciences, The University of Science, Malaysia
This study received financial contribution as an unrestricted educational grant from Servier Pharmaceutical (Malaysia) Pte. Ltd.
1. Matsumoto K, Miyake S, Yano M et al. Glucose tolerance, insulin secretion and insulin sensitivity in non-obese and obese Japanese subjects. Diabetes Care. 1997; 20(10): 1562-8.
2. Davis TME, Pramukkul P, Suputtamongkol Y et al. Glucose tolerance in rural diabetic Thais, first degree relatives and non-diabetic controls. Diabetes Res. Clin. Pract. 1995; 27(3): 171-80.
3. Kim DJ, Lee MS, Kim KW et al. Insulin secretory dysfunction and insulin resistance in the pathogenesis of Korean type 2 diabetes mellitus. Metab. 2001; 50(5): 590-3.
4. Groop I, Ekstrand A, Forsblom C et al. Insulin resistance, hypertension and microalbuminuria in patients with type 2 diabetes mellitus. Diabetologia. 1993; 36(7): 642-7.
5. Taniguchi A, Nakai Y, Sakai M et al. Relationship of regional adiposity to insulin resistance and serum triglyceride levels in non-obese Japanese type 2 diabetic patients. Metab. 2002; 51(5): 544-8.
6. Taniguchi A, Fukushima M, Sakai M et al. The role of BMI and triglyceride levels in identifying insulin-sensitive and insulin resistance variants in Japanese non-insulin-dependent diabetic patients. Metab. 2000; 49(8): 1001-5.
7. Taniguchi A, Nakai Y, Sakai M et al. Relationship of regional adiposity to insulin resistance in non-obese Japanese type 2 diabetic patients. Diabetes Care. 2001; 24(5): 966-7.
8. Haffner SM, D'Agostino R, Mykkanen L et al. Insulin sensitivity in subjects with type 2 diabetes: relationship to cardiovascular risk factors (The Insulin Resistance Atherosclerosis Study). Diabetes Care. 1999; 22(4): 562-8.
9. Gabir MM, Hanson RL, Diabelea D et al. The 1997 American Diabetic Association and 1999 World Health Organization criteria for hyperglycemia in the diagnosis and prediction of diabetes. Diabetes Care. 2000; 23(8): 1108-12.
10. Matthews DR, Hosker JP, Rudenski AS et al. Homeostatic Model Assessment: Insulin resistance and beta cell function from fasting plasma glucose and insulin concentration in man. Diabetologia. 1985; 28(7): 412-9.
11. Ismail IS, Wan Bebakar WM, Noor MI et al. Malaysia clinical practice guidelines on management of obesity, 2003. Academy of Medicine Malaysia.
12. World Health Organization / International Association for the Study of Obesity task Force 2000. The Asia Pacific Perspective: redefining obesity and its treatment. Accessed at http://www.idi.org.au/home.htm on 1 November 2009.
13. Fukushima M, Usami M, Ikeda M et al. Insulin secretion and insulin sensitivity at different stages of glucose tolerance: A cross-sectional study of Japanese type 2 diabetes. Metab. 2004, 53(7): 831-5.
14. Bonora E, Formentini G, Calcaterra F et al. HOMA-estimated insulin resistance is an independent predictor of cardiovascular disease in type 2 diabetic subjects: Prospective data or the Verona Diabetes Complications Study. Diabetes Care. 2002; 25(7): 1135-41.
15. Festa A, Williams K, Hanley AJG et al. Beta cell dysfunction in subjects with impaired glucose tolerance and early type 2 diabetes. Diabetes. 2008, 57(6): 1638-44.
16. Chan J, Malik V, Jia WP et al. Diabetes in Asia: Epidemiology, risk factors and pathophysiology. J. Am. Med. Assoc. 2009, 301(20): 2129-40.
17. Lee TH. Prevalence of obesity on Korean non-insulin-dependent diabetic patients. Diabetes Res. Clin. Pract. 1996; 32(1-2): 71-80.
18. Yoon KH, Lee JH, Kim JW et al. Epidemic obesity and type 2 diabetes in Asia. Lancet. 2006; 368(9548): 1681-8.
19. Raji A, Seely EW, Arky RA et al. Body fat distribution in healthy Asian Indians and Caucasians. J. Clin. Endocriol. Metab. 2001; 86(11): 5366-71.
20. Abate N, Garg A, Peshock RM et al. Relationship of generalized and regional adiposity to insulin sensitivity in men with non-insulin-dependent diabetes mellitus. Diabetes. 1996, 45(12): 1684-93.
21. Gautier J, Mourier A, de Kerviler E et al. Evaluation of abdominal fat distribution in non-insulin-dependent diabetes mellitus: Relationship to insulin resistance. J. Clin. Endocrinol. Metab. 1998; 83(4):1306-11.
22. Banerji MA, Chaiken RL, Gordon D et al. Does intra-abdominal adipose tissue in black men determine whether non-insulin-dependent diabetes mellitus is insulin resistant or insulin sensitive? Diabetes. 1995; 44(2): 141-6.
23. Molist-Brunet N, Jimenco-Molet J and Franch-Nadal J. Correlations between various measures of obesity and degree of resistance to insulin. Aten Primaria. 2006; 37(1): 30-6.
24. Farin HMF, Abbasi F and Reaven GM. Body Mass Index and waist circumference both contribute to differences in insulin-mediated glucose disposal in no-diabetics adults. Am. J. Clin. Nutr. 2006; 83(1): 47-51.
25. Janssen I, Heymsfiled SB, Allison DB et al. Body Mass Index and waist circumference independently contribute to the prediction of non-abdominal, abdominal subcutaneous and visceral fat. Am. J. Clin. Nutr. 2002; 75(4): 683-8.
26. Chan DC, Watts GF, Barett PH et al. Waist circumference, waist-to-hip ratio and Body Mass Index as predictors of adipose tissue compartments in men. Q. J. Med. 2003; 96(6): 441-7.
27. Wagenknect LE, Langefield CD, Scherzinger AL et al. Insulin sensitivity, insulin secretion and abdominal fat: The Insulin Resistance Atherosclerosis Family Study. Diabetes. 2003; 52(10): 2490-6.
28. Kelley DE, Thaete FL, Troost F et al. Subdivisions of subcutaneous abdominal adipose tissue and insulin resistance. Am. J. Physiol. Endocrinol. Metab. 2000; 278(5): E941-8.
29. Laakso M, Sarlund H and Mykkanen L. Essential hypertension and insulin resistance in non-insulin dependent diabetes. Eur. J. Clin. Invest. 1989; 19(6): 518-26.
30. Lear SA, Humphries KH, Kohlik S et al. Visceral adipose tissue accumulation differs according to ethnic background: Results of the Multi-cultural Community Health Assessment Trail (M-CHAT). Am. J. Clin. Nutr. 2007; 86(2): 353-9.
31. Chan SP, Rokiah P, Lee LF et al. Progression of glucose intolerance and diabetes mellitus in a 10-year follow-up study of non-communicable diseases in a rural population, presented at the 10th Congress of ASEAN Federation of Endocrine Societies, Bangkok, 1999.
32. Taniguchi A, Fukushima M, Sakai M et al. Insulin-sensitive and insulin-resistant variants in non-obese Japanese type 2 diabetic patients: The role of triglycerides in insulin resistance. Diabetes Care. 1999, 22(12): 2100-1.
33. Wallace TM, Levy JC and Matthews DR. Use and abuse of HOMA modeling. Diabetes Care. 2004; 27(6): 1487-95.
34. Karter AJ, D'Agostino RB, Mayer-Davis EJ et al. Abdominal obesity predicts declining insulin sensitivity in non-obese normoglycemics. The Insulin Resistance Atherosclerosis Study. Diabetes Obes. Metab. 2005; 7: 230-8.
35. Zanariah H, Chandran LR, Wan Mohammad WB et al. Prevalence of diabetes mellitus in Malaysia in 2006: Results of the 3rd National Health and Morbidity Survey. Diabetes Res. Clin. Pract. 2008; 79 (Suppl 1): S21.