Comparison of the Harris-Benedict Equation, Bioelectrical Impedance Analysis, and Indirect Calorimetry for Measurement of Basal Metabolic Rate among Adult Obese Filipino Patients with Prediabetes or Type 2 Diabetes Mellitus
Sybil Claudine Luy and Oliver Allan Dampil
Sybil Claudine R. Luy, MD
Section of Endocrinology, Diabetes and Metabolism
Department of Medicine, St. Luke’s Medical Center, Quezon City
279 E. Rodriguez Sr. Avenue, Quezon City, Philippines 1112
Telefax.: +632-7230101 local 5210
E-mail: sybil_luy@yahoo.com
ORCID: https://orcid.org/0000-0003-3774-8525
e-ISSN 2308-118x
Printed in the Philippines
Copyright © 2018 by the JAFES
Received June 1, 2018. Accepted August 14, 2018.
Published Online First: September 10, 2018.
Objective. To compare mean basal metabolic rate (BMR) estimated using Harris-Benedict equation (HB) and Bioelectrical Impedance Analysis (BIA) and the BMR measured using Indirect Calorimetry (IC) among adult obese Filipino patients with prediabetes or type 2 diabetes mellitus (T2DM).
Methodology. This was a multi-center, cross-sectional study based on review of outpatient medical records of adult, obese Filipino patients with pre-diabetes or type 2 diabetes mellitus who were seen prior to weight loss intervention at the Outpatient Clinic of St. Luke’s Medical Center-Quezon City and the Metabolic and Diabetes Center of Providence Hospital from August 2017 to January 2018. BMR was derived using three methods: Harris-Benedict equation, Bioelectrical Impedance Analysis and Indirect Calorimetry.
Results. A total of 153 subjects were included in the study. Eighty subjects (52%) have pre-diabetes while 73 subjects (48%) were diagnosed with T2DM. The mean BMR measured using IC is 1299±252 kcal/day while estimated mean BMR predicted using HB equation and BIA were 1628±251 kcal/day and 1635+260 kcal/day, respectively. Compared to measurement by IC, HBE and BIA significantly overestimated the mean BMR by 329 and 336 kcal/day, respectively (p value=<0.0001). IC measured BMR showed strong positive correlation with weight and moderate positive correlation with height. Multiple stepwise regression analysis yielded the BMR prediction equation: BMR (kcal/day)=-780.806 + (11.108 x weight in kg) + (7.164 x height in cm).
Conclusion. Among obese Filipinos with T2DM or prediabetes, HB equation and BIA tend to overestimate the BMR measured using IC.
Keywords: basal metabolic rate, Harris-Benedict equation, bioelectrical impedance analysis, indirect calorimetryThe measurement of basal metabolic rate (BMR), defined as the energy required for performing vital body functions at rest, is the largest component of energy expenditure. Several studies reported that fat-free mass or the lean body mass plays a major role in the variations in BMR. Other factors that affect the BMR includes age, sex, diet, thyroid status, exercise, and stress.[1] Since the BMR represents the major component of daily energy expenditure in humans, it is an important calculation for developing, understanding and executing weight-related interventions.[2]
There are several methods to measure energy expenditure, but there is no consensus about which is the most accurate for specific populations.[3] The measurement of BMR via prediction equations, bioelectrical impedance analysis (BIA) and indirect calorimetry (IC) is a common practice in weight clinics and for research.[4] The gold standard for BMR measurement is IC, whereby oxygen consumption and carbon dioxide production in expired air are directly measured for calculation of energy expenditure. Although IC is extremely valid, it is not widely available, has a high cost, is time consuming and requires specialized personnel for its execution. Thus, the majority of BMR estimates for weight loss interventions rely on BMR prediction equations.[5]
The most widely used prediction equation is the Harris-Benedict Equation (HBE), which was developed in 1918 as a simple, easy-to-use and universally available method for calculation of BMR.[6] However, in spite of their widespread use, previous studies have found that prediction equations were inaccurate in various clinical settings. These equations generally take into consideration anthropometric variables such as age, body weight and height of the subjects. As a consequence, they do not permit a valid estimation of BMR in subjects with obesity.[3]Additionally, previous studies show that the predicted BMR equations derived from Caucasian subjects overestimated the BMR of the Asian subjects.[7],[8],[9] These prediction equations estimate BMR by incorporating the patient’s height, weight, gender and age, but not race.
Moreover, literature also supports the inclusion of fat-free mass as a variable in measuring BMR due to its strong correlation with BMR. While fat-free mass is more difficult to measure than body weight, modern technology has resulted in techniques that are efficient, inexpensive and reliable for use in clinical setting. Bioelectrical impedance analysis (BIA) determines the electrical impedance or resistance to flow of an electric current through body tissues, to estimate total body water, which can then be used to determine fat-free mass.[10] However, results of BIA may be influenced by the hydration status, prandial/fasting state, exercise, diuretic use, menstrual period, ethnicity, age or body shape.[3]
Subsequently, improved equations have been developed in an attempt to improve estimates of BMR and reflect racial variations. Among these are equations of Liu et al.,[8] and Yang et al.,[11] which have been developed predominantly for healthy Asian subjects. Similarly, Mifflin et al.,[12] and Owen et al.,[13] have developed predictive equations for overweight and obese Caucasians. However, there is lack of data on the measurement of BMR in adult obese Filipinos with T2DM or prediabetes. Hence, comparing the existing methods of measuring BMR and developing a predictive equation for this group is our interest.
Objectives
General objective
To compare the BMR estimated using Harris-Benedict equation and BIA and the BMR measured using IC among adult obese Filipino patients with pre-diabetes or T2DM.
Specific objectives
- To compare mean BMR estimated using Harris-Benedict equation and BIA and the BMR measured using IC among adult obese Filipino patients with pre-diabetes or T2DM.
- To determine the correlation between measured BMR (using IC) and the following factors:
- Age
- Sex
- Height
- Weight
- Body mass index (BMI)
- Neck circumference
- Wrist circumference
- Waist circumference
- Hip circumference
- Waist-to-hip ratio
- Fat-free mass
3. To develop a predictive equation to estimate the basal metabolic rate among adult obese Filipino patients with pre-diabetes or type 2 diabetes mellitus.
METHODOLOGYThis was a multi-center, cross-sectional study based on review of outpatient medical records of patients who were seen prior to weight loss intervention at the Outpatient Clinic of St. Luke’s Medical Center-Quezon City and the Metabolic and Diabetes Center of Providence Hospital-Quezon City from August 2017 to January 2018. Included were adult Filipino patients aged 18 years to 65 years old diagnosed with pre-diabetes or T2DM based on the American Diabetes Association criteria with computed body mass index (BMI) of >25 kg/m2, complete anthropometric measurements (weight, BMI, neck circumference, wrist circumference, waist circumference, hip circumference, waist-to-hip ratio), and basal metabolic rate data derived using HB, BIA, and IC. Exclusion criteria included type 1 diabetes or types of diabetes other than type 2 diabetes mellitus, current steroid use, chronic use of steroid defined as any dose >1 week duration within the past 3 months of IC measurement, history of any thyroid conditions, including but not limited to history of thyroid cancer, hypothyroidism, thyrotoxicosis or any history of abnormal thyroid function tests or history or current intake of any of the following medications: carbimazole, strumazole, methimazole, propylthiouracil, liothyronine or levothyroxine, history of use of illicit drug or other psychoactive drugs, recent myocardial infarction, stroke or major surgery within the past 3 months of IC measurement, pregnant or breastfeeding patients, significant weight loss >5% within 3 months prior to measurement of BMR, and patients who have underwent weight loss intervention prior to measurement of BMR.
From the patients’ medical records, the following data were collected: age, sex, anti-diabetic medications, anthropometric measurements (height, weight, BMI, neck circumference, wrist circumference, waist circumference, hip circumference, waist-to-hip ratio), body composition (total body fat, total muscle, visceral fat) and basal metabolic rate (Harris-Benedict equation, BIA, indirect calorimetry).
The BMR was determined using three methods. In men, the Harris-Benedict equation formula used was: BMR=66.4730 + 13.7516 x weight in kg + 5.0033 x height in cm – 6.7550 x age in years. In women, BMR=655.0955 + 9.5634 x weight in kg + 1.8496 x height in cm – 4.6756 x age in years.
The second method of estimating BMR was through use of the KaradaScan HBF-362 Bioelectrical Impedance Machine developed by Omron (Kyoto, Japan). The subjects’ age, sex, and height were entered into the machine. A standard 2 kilogram deduction was entered as an adjustment for clothing weight in all subjects. Subjects were then asked to stand barefoot on the metal foot-plates of the machine while holding the handles for 30 seconds.
BMR was measured by indirect calorimetry using Fitmate™GS portable desktop indirect calorimeter developed by Cosmed (Rome, Italy). Previously, Nieman et al., (2006) showed that the FitMateTM system was both reliable and valid during rest and exercise.[10] Prior to BMR measurement using IC, patients fulfilled the following guidelines: no food intake for at least 5 hours, has not exercised for at least 4 hours, has not consumed caffeine for a least 4 hours, has not consumed stimulatory nutrition supplements (such as ephedra or synephrine containing) for at least 4 hours, has not smoked for at least 1 hour, and is not pregnant or lactating. The procedure was conducted in a darkened, quiet room. Soft music was provided upon patient’s request. The canopy hood with veil was placed over a patient’s head. The patient was placed in a semi-reclined position and instructed to comfortably breathe inside the canopy hood, where the expired gas dilutes with room air. The procedure lasted for approximately 20 minutes.
All anthropometric measurements, BIA and IC were done at the Diabetes and Metabolic Center of Providence Hospital conducted by either of the two trained personnel. Fat-free mass (in kg) was determined using the following equation: Free fat mass = weight in kilograms – (weight in kilograms x total body fat percentage measured by BIA).
The sample size was calculated using the computation for difference between 2 means, with level of significance at 0.05 and power set at 95%. Values for the difference in mean and standard deviation were based on a similar study by Ikeda et al.,[14] wherein the mean BMR estimated using Harris-Benedict equation was 1388±309 kcal/day and the mean BMR measured using IC was 1260±219 kcal/day. The minimum sample size required in the study is at least 135.
Statistical analysis
The estimated mean BMR derived from BIA and Harris-Benedict equation was compared to the mean BMR measured by IC using paired t-test. The results were reported as the mean ± standard deviation (SD). The degree of agreement between the estimated and measured BMR was evaluated by Bland-Altman limits of agreement analysis. The limits of agreement was defined as the mean difference ±2 standard deviations. The estimated accuracy was defined as the percentage of the subjects whose predicted BMR was within ±10 % of measured BMR. Overestimation and underestimation was defined as >10 % and <10 % of measured BMR, respectively. For the correlation of measured BMR with age, anthropometric measurements and sex, the Pearson’s correlation coefficient and Spearman’s rank correlation were used. Multiple stepwise regression analysis was used to derive a predictive equation to estimate BMR among adult obese Filipino patients with pre-diabetes or type 2 diabetes mellitus.
Ethical consideration
The study has been approved by Institutional Ethics Review Committee (IERC) of St. Luke’s Medical Center-Quezon City (RPC-007-01-18). Patient confidentiality was respected by ensuring anonymity of patient records by securing the records in a private room. All study data were recorded and investigators were responsible for the integrity of the data i.e., accuracy, completeness, legibility, etc. The manner of disseminating and communicating the study results guaranteed the protection of confidentiality of patient data.
Data collection was done by the main investigator. Patient code instead of name was used as identifier. Only the ages and sex of the patients were revealed. To ensure confidentiality, research records were kept in a locked file, and all electronic information were coded and secured using a password-protected file. The study files will be kept by the investigator in a locked cabinet for 3 years, after which paper records will be shredded and recycled. Records stored on a computer hard drive will be erased to remove all data from the storage device. For data stored on USB drive, the storage device will be physically destroyed. Any trial-related monitoring, audits, IERC review, and regulatory inspections shall be allowed by providing direct access to source data/documents.
A total of 153 subjects were included in the study. The clinical and demographic characteristics of the subjects are shown in Table 1. Mean age of patients was 41.8±12.3 years old (range: 20 to 64 years old). There is a larger percentage of female (70%) subjects (n=107). Eighty subjects (52%) have pre-diabetes while 73 subjects (48%) were diagnosed with T2DM. Most patients with pre-diabetes were managed with lifestyle modification (95%). Eighty-one percent of diabetic patients were on oral diabetes agents only.
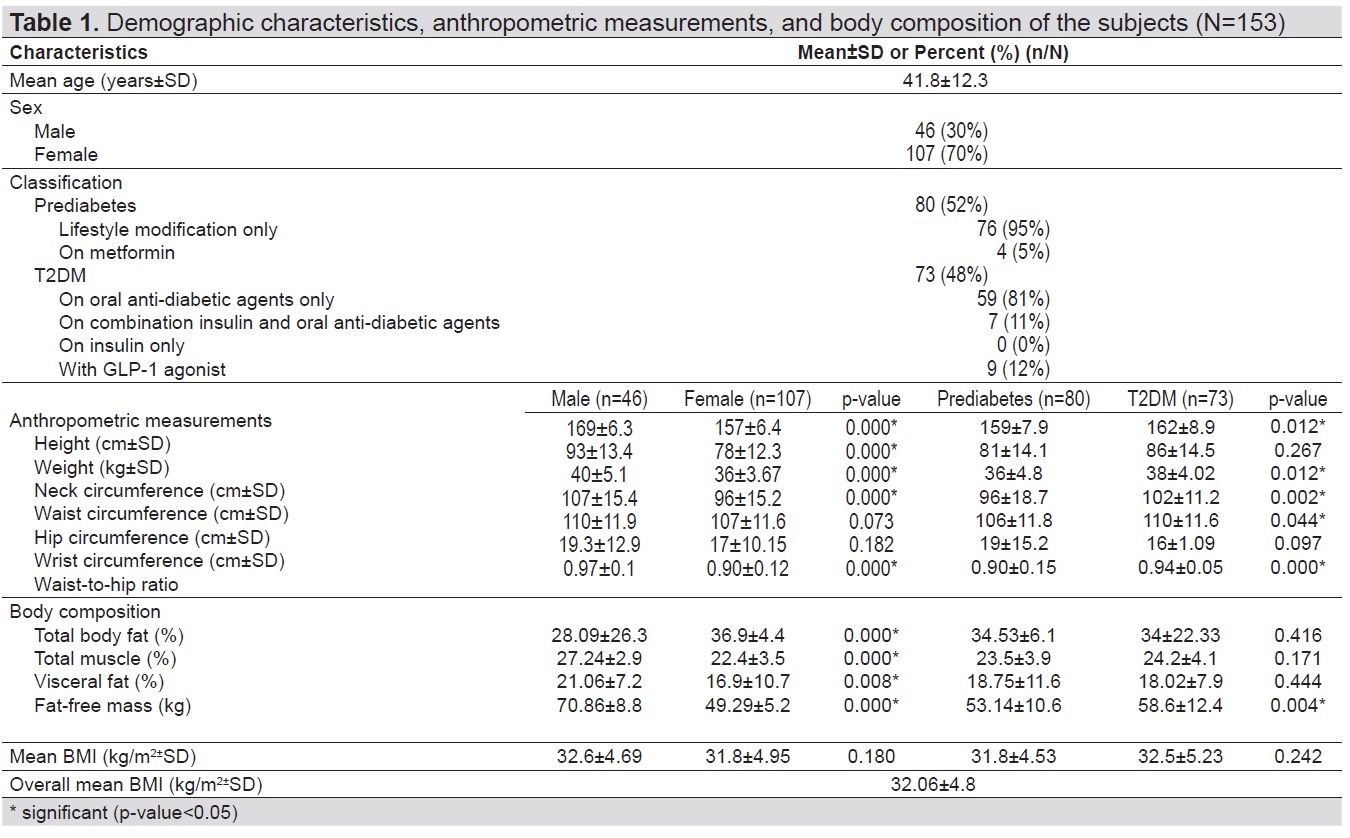
Table 1. Demographic characteristics, anthropometric measurements, and body composition of the subjects (N=153)
There were significant differences between the mean height (p-value=<0.0001), weight (p-value<0.0001), neck circumference (p-value<0.0001), waist circumference (p-value<0.0001), and waist-to-hip ratio (p-value<0.0001) among male and female subjects, with male subjects having higher anthropometric measurements compared to females. With the exception of weight (p-value=0.267) and wrist circumference (p-value=0.097), all anthropometric measurements of T2DM subjects were significantly higher when compared to pre-diabetic subjects (Table 1).
As shown in Table 1, with regards to body composition, females have significantly higher total body fat (p-value=<0.0001) than male subjects while total muscle and visceral fat (p-value=<0.0001 and 0.008, respectively) were higher in male subjects.The mean BMI were similar for both males and females at 32.6+4.69 kg/m2 and 31.8+4.95 kg/m2, respectively (p-value=0.180). Despite having similar BMI, male subjects were significantly leaner than female subjects, with fat-free mass of 70.86+8.8 kg and 49.29+5.2 kg, respectively (p-value=<0.0001). There were no differences in the body composition between pre-diabetic and T2DM subjects (p-value=0.444, 0.416 and 0.171 respectively) except for fat-free mass. Despite having comparable mean BMI (p-value=0.242), type 2 diabetic subjects are significantly leaner than prediabetic subjects (p-value=0.004).
These measurements were above the cutoffs for overweight/obesity and central obesity associated with cardiometabolic diseases among Filipino adults identified in the study of Pagsisihan et al.[15] In the said study, optimal cut-offs for overweight/obesity and central obesity in males and females are BMI of 24 and 23 kg/m2, waist circumference of 84 and 77 cm, and waist-to-hip ratio of 0.91 and 0.85 respectively.
Table 2 shows the comparison between measured BMR using IC and estimated BMR using HB equation and BIA. The mean BMR measured using IC is 1299±252 kcal/day. Estimated mean BMR predicted using HB equation and BIA were 1628±251 kcal/day and 1635±260 kcal/day, respectively. The mean BMR estimated using the HB equation and BIA significantly overestimated the mean BMR measured using IC by 329 and 336 kcal/day, respectively (p-value=-<0.0001).
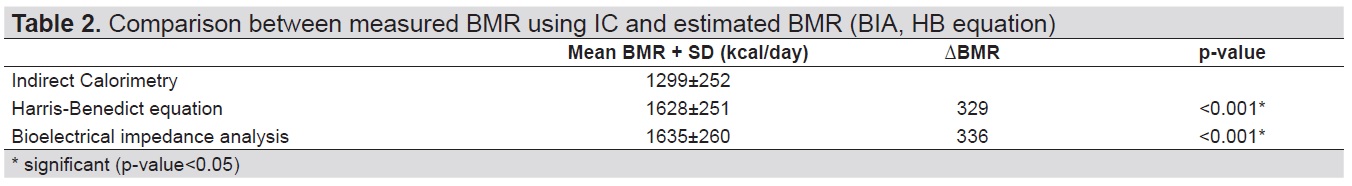
Table 2. Comparison between measured BMR using IC and estimated BMR (BIA, HB equation)
Table 3 summarizes the percentages of accurate, underestimated and overestimated BMR predictions by HB equation and BIA for all subjects. A value is considered accurate when the difference between the estimated BMR and measured BMR (calculated as estimated BMR-measured BMR/measured BMR) is not greater than ± 10%. The percentages of estimated BMR (HB equation and BIA) within +10% of the measured BMR (IC) were only 12% and 11%, respectively. In 88% and 90% of the subjects, BMR were overestimated when HB equation and BIA, respectively, were used to derive the BMR.
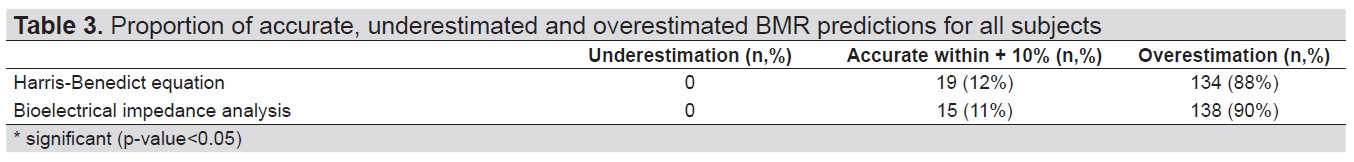
Table 3. Proportion of accurate, underestimated and overestimated BMR predictions for all subjects
The individual differences between measured and predicted BMR plotted against the average of the measured BMR and predicted BMR are shown in the Bland-Altman plots in Figure 1 and 2. Bland-Altman plots displayed the calculated mean of the estimated and measured BMRs against the calculated difference between the estimated and measured BMR for each subject. The mean difference (estimated BMR − measured BMR) was defined by the solid red horizontal line. On the y-axis, the distance of the mean difference line from the zero-difference point visually represented bias. Data points were plotted closest to the zero-difference point for participants whose BMR was most closely predicted to the measured BMR. Two solid horizontal lines, located 2 SD above and below the mean difference line, corresponded to the limits of agreement defined by Bland and Altman.[16] To define limits of agreement, they recommended that at least 95% of the data points should lie within ±2SD of the mean difference.
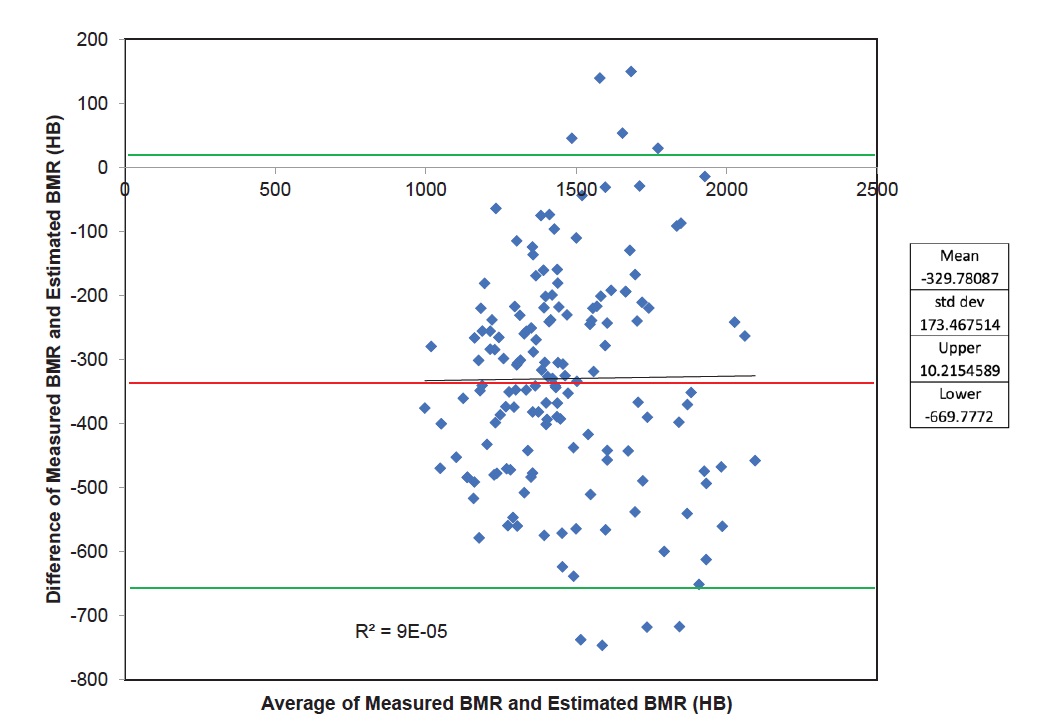
Figure 1. Bland-Altman plot displaying the agreement and bias between the BMR Predicted with the HB equation and the measured BMR using IC. Reference lines represent the mean (red line) of the prediction equation (bias) and the limits of agreement (±2 SD) (green lines). Regression line, coefficient of determination (R2) and p-value for the slope are provided.
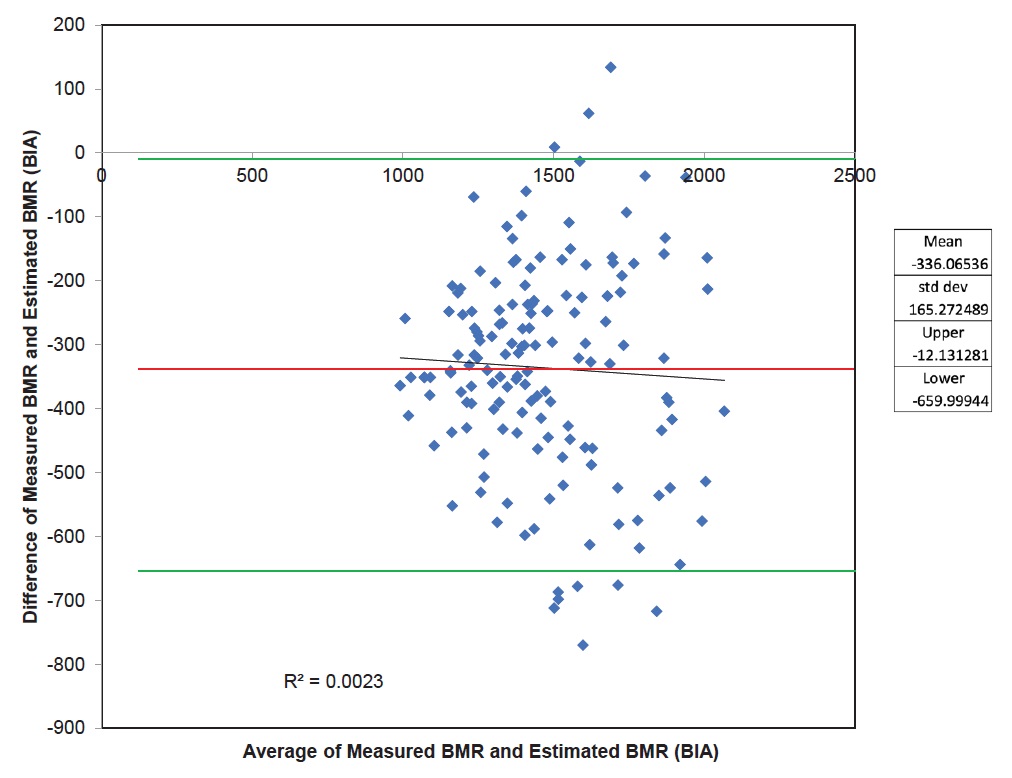
Figure 2. Bland-Altman plot displaying the agreement and bias between the BMR predicted with BIA and the measured BMR using IC. Reference lines represent the mean (red line) of the prediction equation (bias) and the limits of agreement (±2 SD) (green lines). Regression line, coefficient of determination (R2) and p-value for the slope are provided.
In Figure 1, showing the agreement between estimated BMR using Harris Benedict equation and measured BMR using IC, 144 out of 153 (94%) data points lie within ±2SD, 4 (2.6%) out of 153 data points fall beyond -2SD and 5 (3.3%) out of 153 data points lie above ±2SD. Figure 2 presents the agreement between estimated BMR using BIA and measured BMR using IC. One hundred forty-three out of 153 (93%) data points lie within ±2SD, 7 out of 153 (4.6%) data points fall beyond -2SD and 3 out of 153 (2%) data points lie above +2SD. Using the cut-off of at least 95% as proposed by Bland and Altman,[16] there is a lack of agreement between IC and HB equation, and between IC and BIA.
Table 4 shows the association of several variables with measured BMR. Measured BMR showed positive correlation with male sex, height, weight, BMI, neck circumference, wrist circumference, waist circumference, hip circumference, waist-to-hip ratio, and fat-free mass (r=0.538, r=0.578, r=0.762, r=0.482, r=0.507, r=0.048, r=0.498, r= 0.474, and r=0.219, r=0.571 respectively), while age showed negative correlation (r=-0.156). Weight was strongly correlated with measured BMR while other variables are only weakly to moderately correlated with measured BMR.
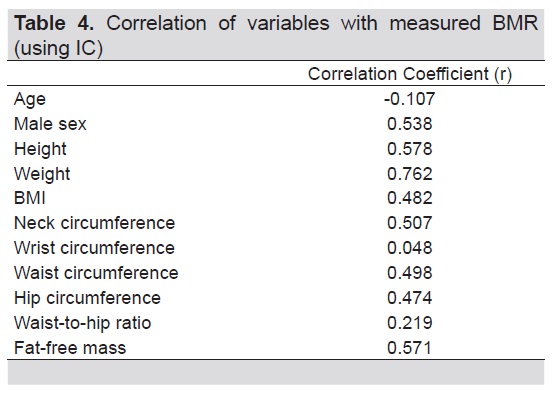
Table 4. Correlation of variables with measured BMR (using IC)
Multiple standard stepwise regression analysis was performed to derive the prediction equation to estimate BMR among adult obese Filipino patients with pre-diabetes or type 2 diabetes mellitus based on IC as the dependent variable, and age, sex, height, weight, BMI, neck circumference, waist circumference, hip circumference and waist-to-hip ratio and fat-free mass as independent variables. The summary of the derivation of the new equation is shown in Table 5. The table shows that only height and weight were significant predictors of BMR. Regression equation with weight as the only independent variable contributed to 58% (adjusted R2=0.577) of BMR variability. The inclusion of height to the model increased the predictive power to 62% (R2=0.617). Hence, the regression equation for predicting the BMR was:
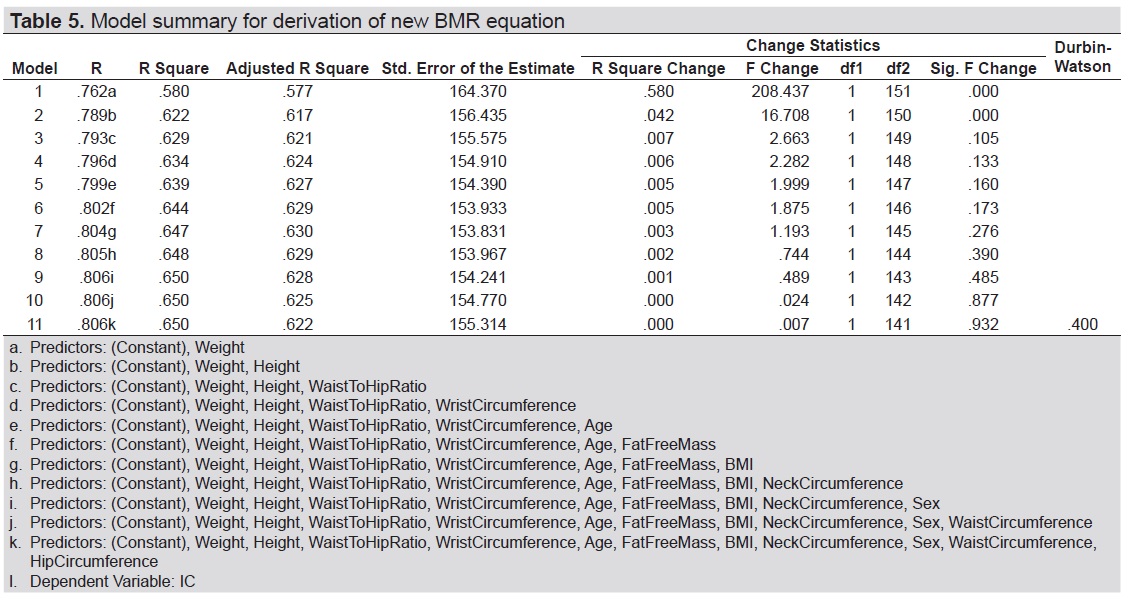
Table 5. Model summary for derivation of new BMR equation
BMR (kcal/day)= -780.806 + (11.108 x weight in kg) + (7.164 x height in cm).
Measurement of energy expenditure is an essential element in the estimation of energy requirements in humans. In this study, the measured BMR of 153 adult Filipino obese patients with prediabetes or T2DM using indirect calorimetry was compared with the results from BMR estimated by HB equation and bioelectrical impedance analysis. Previous studies reported that existing predictive equations derived from Caucasian subjects are not suitable for the Asian population because they tend to overestimate the BMR.[9],[14],[17] Similarly, our result showed that HB equation and BIA overestimate the BMR compared to IC by 329 kcal/day and 336 kcal/day, respectively. The mean BMI of all subjects in the study was 32.06±4.8 kg/m2 with mean total fat percentage of 34.3%. A review by Deurenberg[18] showed that compared to whites, Asian population had a higher fat percentage at similar BMI. This was also the finding in the study of Wouters-Adriaens et al.,[19] in which Asian subjects had an average BMI of 23.4 kg/m2 and a fat percentage of 26.9% while white subjects had similar average BMI of 22.4 and lower fat percentage of 20.1%. They elucidated that the difference in body composition between Asians and whites explained the overestimation of predictive equations in Asian subjects. In a study by Frankenfeld[5] involving adult volunteers across different BMI categories (BMI 22.2 to 61.8 kg/m2), it was reported that the magnitude of error in the HB equation increases with increasing BMI. This result is in agreement with the present study in which BMR values of pre-diabetic or T2DM obese subjects derived from HB equation are overestimated.
In addition, body composition influences energy expenditure, and subsequently may have an effect on the predictive ability of the HB equation. In obese individuals, resting energy expenditure is lower than would be predicted by BMR equations, due to a greater proportion of fat mass versus metabolically active fat free mass. This was reported in the study of Douglas et al.,[20] which assessed the effects of weight history status on the ability of HB formula to predict measured resting energy expenditure. In their study, HB formula significantly overestimated resting energy expenditure among overweight subjects, and was more accurate among normal weight and weight-reduced women, with nearly 300 kcal/day difference in the predicted resting and measured energy expenditure in the overweight group. This was similar to our result which showed that BMR derived using HB equation and BIA overestimate the BMR measured using IC by 329 kcal/day and 336 kcal/day, respectively. They attributed this discrepancy between predicted resting and measured energy expenditure values to body composition. The lower proportion of weight as fat-free mass, which is the largest determinant of resting energy expenditure, in overweight subjects may explain the overestimation of resting energy expenditure by HB formula.
In our study, the HB overestimated the BMR in 86.9% of the subjects. This finding was congruent to that of Miller et al.,[21] which reported that HB equation overestimated the BMR in 86.8% of the young overweight or obese Hispanic women subjects. The disparity was explained by the different population used in the development of the HB equation, which included female participants who were predominantly of normal weight. In addition, the HB sample also differ from the individuals of the abovementioned study because of the dramatic decline in the activity with modern transportation and conveniences. In contrast, among overweight Singaporean Chinese subjects, the HB formula overestimated BMR by an average of 545 KJ (equivalent to 130 kcal) in only 42% of subjects.[17] They rationalized that the HB equation is based on gender, height, weight and age and developed in Caucasian subjects, hence overestimation is expected. It should be noted that in this study, the subjects had lower mean BMI of 26.4±5.4 kg/m2 compared to the subjects in our study. Overestimation of the BMR can hinder successful weight loss intervention programs due to inaccurate computation of an individual’s energy requirements.
The Bland-Altman limits of agreement analysis (LOA) showed BMR generated from HB equation and BIA lack agreement with BMR measures using IC. Due to the wide limits of agreement for both HB equation (LOA=10.21 to -669.77 kcal/day) and BIA (LOA=-12.13 to -659.99) when compared to IC (Figure 1 and 2), clinicians need to be aware of the limitations of this prediction equation and BIA for estimating individual energy requirements.
In the adult obese Filipino subjects with pre-diabetes or T2DM evaluated in this study, the best correlation found with measured BMR was weight (r=0.762). This result is in agreement with the study on adult obese and overweight Chinese with T2DM wherein weight had significant positive correlation with BMR. In the said study, obese patients with T2DM had significantly higher BMRs than overweight patients and controls with normal.[22] In contrast to our finding, the aforementioned study showed that male sex negatively correlated with measured BMR. Previous studies have suggested that males have higher BMR than females independent of sex differences in body composition.[23],[24] However, it was reported that once adjusted for both fat-free mass and fat mass, the impact of sex is not significant. Men generally display a higher absolute resting metabolic rate than women because of their larger quantity of fat-free mass.[25] As in earlier studies,[26],[27] the present study showed that age was negatively correlated with measured BMR. Reduction in fat-free mass quality[28] and decline in both mass and cellular fraction of organs and tissues[29] may account for this age-related decline in BMR.
The derived equation confirmed that BMR is highly correlated with height and weight while the addition of other variables (age and sex) did not contribute significantly to the prediction model. As shown in Table 5, by adding height as the second predictor, the adjusted R square column increased from 0.577 to 0.617. However, R square hardly increased any further by adding a third variable. The Sig. F Change confirms this: the increase in R square from adding a second predictor is statistically significant, [F(1, 150)=16.708,p-value=0.000]. Subsequent addition of a third predictor did not significantly improve r-square any further. Hence, there is no point in including more than 2 variables in the derived model. The newly developed equation based on IC can explain approximately 62.2% of the variance in estimated BMR of the subjects, which will be confirmed in a separate group of subjects in another study.
Among obese Filipinos with T2DM or prediabetes, HB equation or BIA, albeit easy and convenient to use, tends to overestimate the BMR measured using IC.
Limitation of the study and recommendationThe limitation of our study is that the subject recruitment was restricted to those who have access to healthcare facilities and may not be representative of the whole population. Since this study strictly examined data from adult obese Filipinos with pre-diabetes or T2DM, results are not generalizable to other racial/ethnic groups or subjects with different conditions. Further studies involving larger, more heterogeneous cohorts, such as patients with normal BMI, are needed. Likewise, we recommend a cross-validation study on a separate group of adult obese Filipino patients with pre-diabetes or T2DM using the computed prediction equation.
AcknowledgementsThe authors are immensely grateful to their colleagues St. Luke’s Medical Center-Quezon City Section of Endocrinology, Diabetes and Metabolism and Providence Hospital’s Metabolic and Diabetes Center who provided insight and expertise that greatly assisted the research.
Statement of AuthorshipAll authors certified fulfillment of ICMJE authorship criteria.
Author DisclosureThe authors declared no conflict of interest.
Funding SourceNone.
[1] Menon S, Mishra MK, Rathore VS. Prediction of basal metabolic rate on the basis of body composition variable and obesity indicators in physically active postmenopausal women. IJPESH. 2016;3(5):427-30. http://www.kheljournal.com/archives/2016/vol3issue5/PartH/3-5-74-954.pdf
[2] Frankenfield DC, Roth-Yousey L, Compher C. Comparison of predictive equations for resting metabolic rate in healthy non obese and obese adults: A systematic review. J Am Diet Assoc. 2005;105(5):775-89. PubMed CrossRef
[3] Pinheiro Volp AC, Esteves de Oliveira FC, Duarte Moreira Alves R, Bressan J. Energy expenditure: Components and evaluation methods. Nutr Hosp. 2011;6(3): 430-40. PubMed CrossRef
[4] Sabounchi NS, Rahmandad H, Ammerman A. Best-fitting prediction equations for basal metabolic rate: Informing obesity interventions in diverse populations. Int J Obes (Lond). 2013;37(10):1364-70. PubMed PubMed Central CrossRef
[5] Frankenfield DC, Rowe WA, Smith JS, Cooney RN.. Validation of several established equations for resting metabolic rate in obese and non-obese people. J Am Diet Assoc. 2003;103(9):1152-9. PubMed CrossRef
[6] Jia H, Meng Q, Shan C. Study on energy expenditure in healthy adults. Chin J Clin Nutr. 1999;7:70-3.
[7] Valliant, MW, Tidwell DK, Hallam JS, et al. A resting metabolic rate equation including bioelectrical impedance-derived lean body mass provides a better prediction in premenopausal African American women across a spectrum of body mass indices. Top Clin Nutr. 2009;24(2):145-51. CrossRef
[8] Liu HY, Lu YF, Chen WJ. Predictive equations for basal metabolic rate in Chinese adults: A cross-validation study. J Am Diet Assoc. 1995;95(12):1403-8. PubMed CrossRef
[9] Case KO, Brahler CJ, Heiss C. Resting energy expenditures in Asian women measured by indirect calorimetry are lower than expenditures calculated from prediction equations. J. Am. Diet. Assoc. 1997;97(11):1288-92. PubMed CrossRef
[10] Nieman DC, Austin MD, Benezra L, et al. Validation of Cosmed’s FitMate in measuring oxygen consumption and estimating resting metabolic rate. Res Sports Med. 2006;14(2):89-96. PubMed CrossRef
[11] Yang X, Li M, Mao D, et al. Basal energy expenditure in southern Chinese healthy adults: Measurement and development of a new equation. Br J Nutr. 2010; 104(12):1817-23. PubMed CrossRef
[12] Mifflin MD, St Jeor ST, Hill LA, Scott BJ, Daugherty SA, Koh YO. A new predictive equation for resting energy expenditure in healthy individuals. Am J Clin Nutr. 1990;51(2):241-7. PubMed CrossRef
[13] Owen OE, Holup JL, D’Alessio DA, et al. A reappraisal of the caloric requirements of men. Am J Clin Nutr. 1987;46(6):875-85. PubMed CrossRef
[14] Ikeda K, Fujimoto S, Goto M, et al. A new equation to estimate basal energy expenditure of patients with diabetes. Clin Nutr. 2013;32(5):777-82. PubMed CrossRef
[15] Pagsisihan D, Sandoval MA, Pacheco EP, Jimeno CA. Low indices of overweight and obesity are associated with cardiometabolic diseases among adult Filipinos in a rural community. J ASEAN Fed Endocr Soc. 2016;31(2):97-105. CrossRef
[16] Bland JM, DG Altman. Statistical methods for assessing agreement between two methods of clinical measurement. Lancet. 1986;1(8476):307-10. CrossRef
[17] Camps SG, Wang NX, Tan WSK, Henry CJ. Estimation of basal metabolic rate in Chinese: Are the current prediction equations applicable? Nutr J. 2016; 15(79):1-8. PubMed PubMed Central CrossRef
[18] Deurenberg P, Deurenberg-Yap M, Guricci S. Asians are different from Caucasians and from each other in their body mass index/body fat percent relationship. Obes Rev. 2002;3(3):141-6. PubMed
[19] Wouters-Adriaens MP, Westerterp KR. Low resting energy expenditure in Asians can be attributed to body composition. Obesity (Silver Spring). 2008;16(10):2212-6. PubMed CrossRef
[20] Douglas CC, Lawrence JC, Bush NC, Oster RA, Gower BA, Darnell BE. Ability of the Harris Benedict formula to predict energy requirements differs with weight history and ethnicity. Nutr Res. 2007;27(4):194-9. PubMed PubMed Central NIHMSID: NIHMS21916.
[21] Miller S, Milliron BJ, Woolf K. Common prediction equations overestimate measured resting metabolic rate in young hispanic women. Top Clin Nutr. 2013; 28(2):120-35. PubMed PubMed Central CrossRef
[22] Sun MX, Zhao S, Mao H, Wang ZJ, Zhang XY, Yi L. Increased BMR in overweight and obese patients with type 2 diabetes may result from an increased fat-free mass. J Huazhong Univ Sci Technol Med Sci. 2016;36(1):59-63. PubMed CrossRef
[23] Poehlman ET, Toth MJ, Ades PA, Calles-Escandon J. Gender differences in resting metabolic rate and noradrenaline kinetics in older individuals. Eur J Clin Invest. 1997;27(1):23-8. PubMed
[24] Molnár D, Schutz Y. The effect of obesity, age, puberty and gender on resting metabolic rate in children and adolescents. Eur J Pediatr. 1997;156(5):376-81. PubMed\
[25] Johnstone AM, Murison SD, Duncan JS, Rance KA, and Speakman JR. Factors influencing variation in basal metabolic rate include fat-free mass, fat mass, age, and circulating thyroxine but not sex, circulating leptin, or triiodothyronine. Am J Clin Nutr. 2005;82(5):941-8. PubMed CrossRef
[26] Piers LS, Soares MJ, McCormack LM, O’Dea K. Is there evidence for an age-related reduction in metabolic rate? J Appl Physiol (1985). 1998;85(6):2196-204. PubMed CrossRef
[27] Wang Z, Heshka S, Heymsfield SB, Shen W, Gallagher D. A cellular-level approach to predicting resting energy expenditure across the adult years. Am J Clin Nutr. 2005;81(4):799–806. PubMed CrossRef
[28] Lazzer S, Bedogni J, Lafortuna CL, et al. Relationship between basal metabolic rate, gender, age, and body composition in 8,780 white obese subjects. Obesity (Silver Spring). 2010;18(1):71-8. PubMed CrossRef
[29] Wang Z, Heshka S, Wang J et al. Metabolically active portion of fat-free mass: A cellular body composition level modeling analysis. Am J Physiol Endocrinol Metab. 2007;292(1):E49-53. PubMed PubMed NIHMSID: NIHMS132234 CrossRef
[30] Schofield WN. Predicting basal metabolic rate, new standards and review of previous work. Hum Nutr Clin Nutr. 1985;39(Suppl 1):5-41. PubMed
Authors are required to accomplish, sign and submit scanned copies of the JAFES Author Form consisting of: (1) Authorship Certification, that all the requirements for authorship have been met by each author, and that the final version of the manuscript has been read and approved by all authors; (2) the Author Declaration, that the article represents original material that is not being considered for publication or has not been published or accepted for publication elsewhere; (3) the Statement of Copyright Transfer [accepted manuscripts become the permanent property of the JAFES and are licensed with an Attribution-Share Alike-Non-Commercial Creative Commons License. Articles may be shared and adapted for non-commercial purposes as long as they are properly cited]; and the ICMJE form for Disclosure of Potential Conflicts of Interest. For original articles, authors are required to submit a scanned copy of the Ethics Review Approval of their research as well as registration in trial registries as appropriate. For manuscripts reporting data from studies involving animals, authors are required to submit a scanned copy of the Institutional Animal Care and Use Committee approval. For Case Reports or Series, and Images in Endocrinology, consent forms, are required for the publication of information about patients; otherwise, appropriate ethical clearance has been obtained from the institutional review board. Articles and any other material published in the JAFES represent the work of the author(s) and should not be construed to reflect the opinions of the Editors or the Publisher.