Joseph Noel S. Fernando, MD
Section of Endocrinology, Diabetes and Metabolism
Chinese General Hospital and Medical Center
286 Blumentritt Road, Sampaloc, Manila 1014, Philippines
Tel. No.: +632-8711-4141
Fax No.: +632-8731-8252
E-mail: cgh_mdir@yahoo.com
ORCiD: https://orcid.org/0000-0003-3459-0814
e-ISSN 2308-118x
Printed in the Philippines
Copyright © 2019 by the JAFES
Received May 31, 2019. Accepted July 28, 2019.
Published Online First: November 10, 2019.
* This manuscript was presented as poster abstract in the Philippine Society of Endocrinology, Diabetes and Metabolism Annual Convention last March 14, 2019 at the EDSA Shangri-La Hotel, Mandaluyong City, Philippines; and as oral presentation in the 19th Endocrine Fellows’ Research Forum last February 21, 2019 held at Makati City, Philippines.
Objective. This study aims to determine the relationship between the different factors associated with the severity of Fibroscan with CAP findings among patients with Type 2 diabetes and fatty liver.
Methodology. This is a cross-sectional study. Seven hundred four Fibroscan with Controlled Attenuation Parameter (CAP) results were electronically retrieved from a diagnostic center. Two hundred eighty-five charts of diabetic patients with fatty liver on ultrasound were reviewed. One hundred sixty-four patients with fatty liver on ultrasound and Fibroscan with CAP were included in the study. Several factors were analysed in relation to the severity of Fibroscan with CAP findings in the study group.
Conclusion. Factors associated with the severity of hepatic fibrosis, cirrhosis and steatosis included above normal BMI, disease duration of >5 years, poor glycemic control and elevated levels of ALT, and serum triglycerides.
Keywords: type 2 diabetes, NAFLD, transient elastographyNon-alcoholic fatty liver disease (NAFLD) is increasingly recognized as the liver disease component of metabolic syndrome.[1] NAFLD is present when >5% of hepatocytes are steatotic in patients who do not consume excessive alcohol (i.e. <20 g/day for women and <30 g/day for men) and ranges in severity from simple steatosis (fat without significant hepatic inflammation or hepatocellular injury, to steatohepatitis (fat with hepatocellular injury and hepatic inflammation), to advanced fibrosis and cirrhosis.[2]
The definition of NAFLD by the American Association for the Study of Liver Disease (AASLD) requires that (a) there is evidence of hepatic steatosis, either by imaging or histology and (b) there are no causes for secondary hepatic fat accumulation such as significant alcohol consumption, use of steatogenic medications, or hereditary disorders. In the majority of patients, NAFLD is associated with metabolic risk factors such as obesity, diabetes mellitus, and dyslipidemia.[1]
Up to 90% of patients with NAFLD have simple steatosis, which carries a relatively benign prognosis,[3] with no overall increase in mortality.[4],[5],[6] However, approximately 10-30% have the potentially progressive form of NAFLD, non-alcoholic steatohepatitis (NASH), which is associated with hepatocellular injury and inflammation.[4],[7],[8] Approximately 25-40% of patients with NASH develop progressive liver fibrosis, ultimately resulting in cirrhosis in 20-30%.[4],[6],[9],[10],[11]
NAFLD and Type 2 diabetes mellitus frequently coexist because they share the risk factors of excess adiposity and insulin resistance. The prevalence of Type 2 diabetes or impaired fasting glucose ranges from 18–33% in patients with NAFLD, whereas, NAFLD ranges from 49–62% in type 2 diabetes patients. NASH is present in 12.2% of patients with Type 2 diabetes, as compared to 4.7% in those without Type 2 diabetes. Moreover, Type 2 diabetes increases the risk of liver-related death by up to 22-fold as well as overall death by 2.6–3.3-fold in patients with NAFLD.[12]
The reported prevalence of NAFLD when defined by liver ultrasound ranged between 17% and 46% depending on the population studied. In a study consisting of nearly 400 middle-aged individuals, the prevalence of NAFLD defined by ultrasonography was 46% and the prevalence of histologically confirmed NASH was 12.2%. Estimates of the worldwide prevalence of NAFLD ranges from 6.3% to 33% with a median of 20% in the general population based on a variety of assessment methods.[13]
An ultrasonographic study of patients with Type 2 diabetes showed a 69% prevalence of NAFLD.[14] In another study, 127 of 204 patients with diabetes displayed fatty infiltration on ultrasound, and 87% of the patients with fatty infiltration who consented to biopsy had histologic confirmation of NAFLD.[15]
Ultrasonography is recommended as first-line diagnostic screening test for NAFLD by the European Association for the Study of the Liver (EASL), the European Association for the Study of Diabetes (EASD) and the European Association for the Study of Obesity (EASO). In their recent recommendations, biomarkers, fibrosis scores and transient elastography are considered acceptable noninvasive procedures for the identification of cases with low risk of advanced fibrosis/cirrhosis.[16]
Current guideline postulates that liver biopsy is the most reliable approach for identifying the presence of steatohepatitis and fibrosis in patients with NAFLD, but it is generally acknowledged that biopsy is limited by cost, sampling error, and procedure-related morbidity and mortality.[1]
Current guidelines state that a liver biopsy is the only way to diagnose NASH, and non-invasive techniques have not been fully validated for diagnosing this condition. However, empiric therapy is included as an option for patients unwilling or unable to undergo a liver biopsy. The American Diabetes Association has made an algorithm for the diagnosis of NAFLD and NASH in patients with prediabetes or Type 2 diabetes mellitus in clinical practice (See Appendix A).[17]
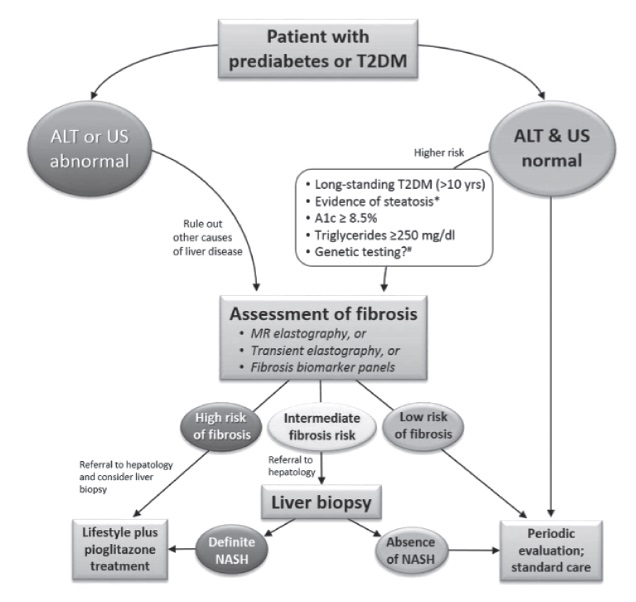
Appendix A. The algorithm for the diagnosis of NAFLD and NASH in patients with prediabetes and type 2 diabetes mellitus in clinical practice.[17]
Transient elastography (Fibroscan, Echosens, Paris, France) is a non-invasive method of assessing liver fibrosis which can be performed at the bedside or in an outpatient clinic. It uses ultrasound-based technology to measure liver stiffness. Although Fibroscan is less well validated in NAFLD, in a study of 97 NAFLD patients, Area under the receiver operating characteristics (AUROCs) for the diagnosis of significant fibrosis, severe fibrosis, and cirrhosis were reported to be 0.88, 0.91, and 0.99, respectively. Another study including 246 NAFLD patients showed AUROCs for the diagnosis of moderate fibrosis, bridging fibrosis, and cirrhosis of 0.84, 0.93, and 0.95, respectively.[18]
Reproducibility of transient elastography is important for its widespread application. The reproducibility of liver stiffness measurement (LSM) was excellent for both interobserver and intra-observer agreement, with intraclass correlation coefficients (ICC) of 0.98.[19] For NASH with advanced fibrosis, pooled AUROC, sensitivity and specificity of Fibroscan are 0.94 (0.90-0.99), 0.94 (0.88-0.99) and 0.95 (0.89-0.99).[20]
A novel non-invasive tool based on ultrasound attenuation has been developed for use with the Fibroscan to assess liver steatosis. Measuring ultrasound attenuation in biological tissues is of great interest because it is related to the composition of tissues and, thus, reflects their pathological state. Transient elastography with Controlled Attenuation Parameter (CAP) is non-invasive and allows measurement of hepatic fat content in numerical scores (See Appendix B). CAP is evaluated using the same radio-frequency data and the same region of interest, as the region used to assess the LSM. CAP is guided by vibration-controlled transient elastography (VCTETM), which ensures the operator automatically obtains an ultrasonic attenuation value of the liver. CAP was shown to be significantly correlated with steatosis grade (Spearman=0.81, P<10−16). CAP was shown to be independent of fibrosis stage, and satisfactorily detected steatosis, with AUROCs for the diagnosis of S1, S2 and S3 of 0.91 (0.86~0.97), 0.95 (0.9~1) and 0.89 (0.75~1), respectively.[21]
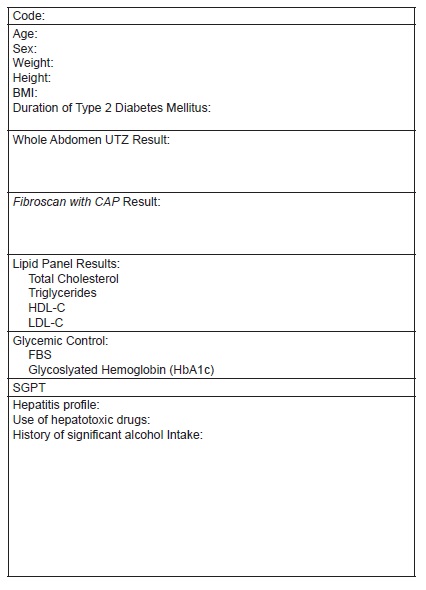
Appendix B. Data collection tool form
Compared with patients without diabetes, people with Type 2 diabetes have an increased risk of developing NAFLD. The presence of NAFLD in patients with Type 2 diabetes is linked to increased cardiovascular disease risk independently from the components of the metabolic syndrome.
As a result of the increasing incidence of NAFLD in Type 2 diabetes and metabolic syndrome, with its associated morbidity and mortality, screening for NAFLD in all patients with one or more metabolic syndrome components by a noninvasive method, such as Transient Elastography with CAP, appears reasonable. Hence, the diagnosis and evaluation of fatty liver is an important part of the management of diabetes. When diabetes patients are diagnosed with NAFLD, more intensive monitoring and therapeutic intervention are necessary to avoid complications of liver fibrosis and cirrhosis, especially hepatocellular carcinoma.
General objective
This study aims to determine the relationship between the different factors associated with the severity of Fibroscan with CAP findings among patients with Type 2 diabetes and fatty liver seen at Chinese General Hospital and Medical Center.
Specific objectives
- To define the metabolic profile of type 2 diabetic patients with fatty liver on ultrasound and Fibroscan with CAP.
- To determine the prevalence of hepatic fibrosis, cirrhosis and steatosis on Fibroscan with CAP.
- To determine the association of the demographic factors (age, gender), clinical factors (weight, BMI, duration of diabetes), biochemical tests (lipid profile, ALT, FBS, HbA1c), and transient elastography findings of patients with Type 2 diabetes with fatty liver on ultrasound.
Study design, setting and participants
We performed a cross-sectional analytic study utilizing chart reviews of qualified patient profiles from January 2017 to June 2018. Seven hundred four Fibroscan with CAP results were retrieved electronically at a local, independent diagnostic center. This diagnostic test was done as part of routine work-up for patients with fatty liver on ultrasound on an outpatient setting. Complete enumeration of study subjects was done. We identified 285 subjects with Type 2 diabetes mellitus. Applying the inclusion and exclusion criteria, we were able to come up with the total number of 164 subjects eligible for the study. One hundred twenty-one subjects were excluded in the study due to absence of fatty liver on abdominal ultrasound. A review on the clinical records and laboratory results was done at attending physicians’ clinics. Only those patients under the care of physicians from Chinese General Hospital and Medical Center were included in the study. Anthropometric (body mass index, height, weight) and laboratory parameters (fasting blood sugar, ALT, glycosylated hemoglobin (HbA1c), and fasting lipid profile) were recorded in a data collection form. Duration of Type 2 diabetes mellitus was also noted (Figure 1). All pertinent information were gathered and recorded at the period when the Fibroscan with CAP was done. Clinic records of patients were checked for history of hepatitis infection thru results of serologic tests, significant alcohol intake (>1 drink per day for adult women, >2 drinks per day for adult men), use of liver supplement medications, or hepatotoxic drug use (See Appendix B). All patients enlisted had undergone abdominal ultrasonography and Fibroscan with CAP performed by an experienced operator. To avoid observer variability and to maintain consistency of transient elastography readings, only results read by same authorized trained personnel were accounted for in the study.
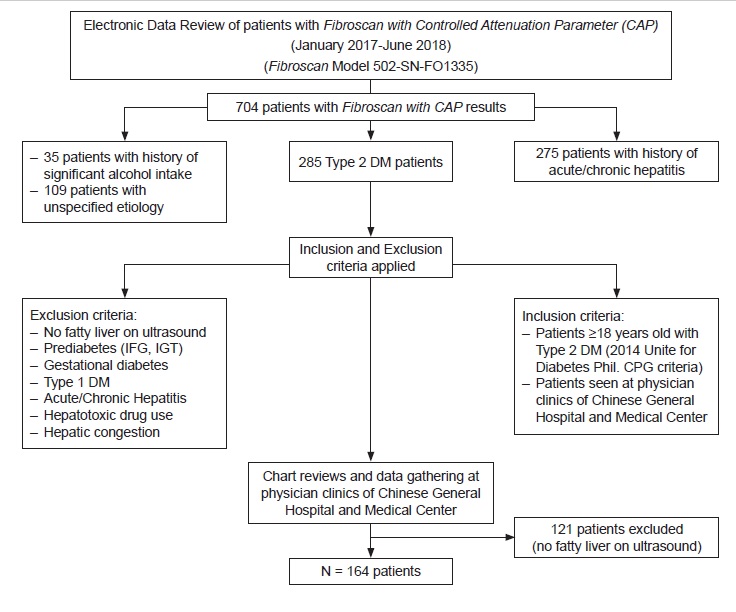
Figure 1. Summary of the study procedure.
Study variables
Multiple independent variables were analyzed in relation to the occurrence of hepatic steatosis, fibrosis and cirrhosis (dependent variable). Age and disease duration categorizations were based on previous epidemiological studies on diabetes and NAFLD.[22],[23] BMI was computed by dividing subject’s weight (kg) with height (m2). The Asia- Pacific Asian BMI criteria were used to group patients into underweight, normal, overweight and obese subjects.[24] Glycemic control was defined by the fasting blood sugar and HbA1c levels of the patients. Poorly controlled diabetes is reflected by a fasting blood sugar of >126 mg/dl and HbA1c of >7% as stated in the 2018 American Diabetes Association (ADA) Standards of Medical Care in Diabetes. Blood cholesterol and triglyceride levels categorization into optimal, normal, desired or high levels were based on the National Cholesterol Education Program – Adult Treatment Panel (NCEP-ATP III) 2001 guidelines (See Appendix C). SGPT levels were described to be above 2x or 3x normal based on individual laboratory reference cut-off.
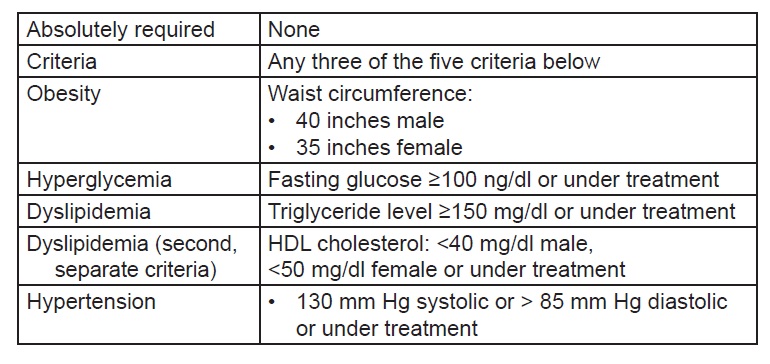
Appendix C. Definition of metabolic syndrome by NCEP ATP III (2005 Revision).
Sample size computation
Sample size for this study was computed based on the proportion of patients with fatty liver of 0.58 and the proportion with no fatty liver of 0.42. In a computation for comparison of two proportions carried out at 95% confidence level or z-value at 1.96, a sample of 164 patients with Type 2 diabetes with hepatic steatosis, fibrosis and cirrhosis on Fibroscan with CAP was taken from a total of 285 patients from the ideal sample size computation.
Inclusion and exclusion criteria
The study included patients 18 years old and above who were diagnosed with Type 2 diabetes mellitus based on the 2015 Unite for Diabetes Philippines Clinical Practice Guidelines (See Appendix D).[25] Patients with the following attributes were excluded in the study: patients with no fatty liver on ultrasound, impaired fasting glucose, impaired glucose tolerance, gestational diabetes, Type 1 diabetes mellitus; history of liver disease secondary to chronic alcohol intake, acute or chronic viral infections like hepatitis A, B and C; hepatotoxic drug use and intake of liver supplements; cholestasis; hepatic congestion.
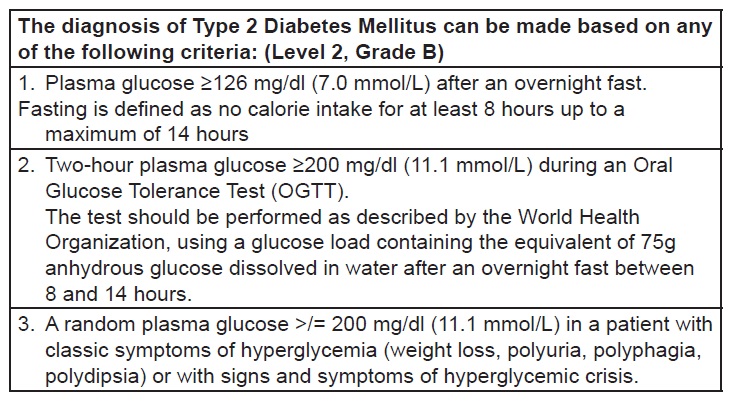
Appendix D. Criteria for the diagnosis of type 2 diabetes mellitus (Philippines UNITE for Diabetes Clinical Practice Guideline 2014)[25]
Interpretation of transient elastography results
The interpretation of transient elastography results were based on the cut-off parameters laid out by a reliable, independent diagnostic center which utilized the M Probe of Fibroscan device model 502-SN-FO1335 (See Appendix E) handled by a single experienced operator. Interpretation guide for diagnosing nonalcoholic fatty liver disease (NAFLD) were as follows: for liver stiffness measurement (LSM): F0-F1 - minimal or no fibrosis (≥5.8 kPa), F2 – possible intermediate fibrosis (>5.8-<9.6 kPa), F3 - advanced fibrosis (>9.6-11.5 kPa), F4 - Cirrhosis (>11.5 kPa); for controlled attenuation parameter (CAP): Grade S0 - <10% fatty infiltration (<221 dB/m), Grade S1 – 11-33% fatty infiltration (222-232 dB/m), Grade S2 – 34-66% fatty infiltration (233-289 dB/m), Grade S3 – >66% fatty infiltration (≥290 dB/m).
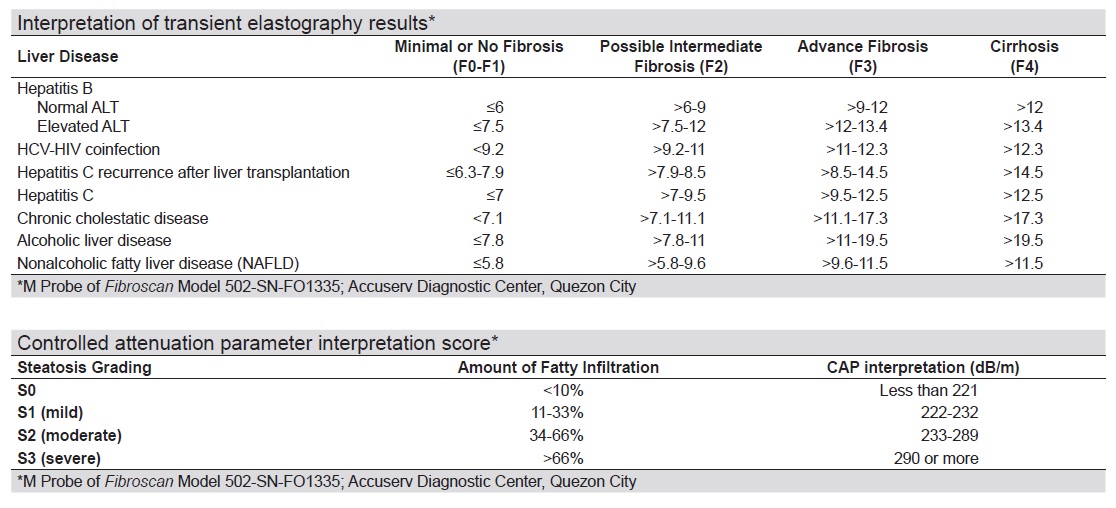
Appendix E. Interpretation of transient elastography results*
Data analysis
Descriptive analysis of the different sociodemographic and clinical characteristics of the study population was done using means and percentages. Standard deviation was computed as a measure of dispersion for data results with means. The prevalence rate of detecting fatty liver on Fibroscan with CAP was determined. Logistic regression analysis of the different variables in the study was done to determine the odds of developing hepatic steatosis, fibrosis and cirrhosis. The estimated or crude odd ratios were then computed. The variables analyzed categorically included age, body mass index, diabetes duration, total cholesterol level, triglyceride level, HDL-C and LDL-C levels, and fasting blood sugar and ALT levels. The Chi square test for independence was used to establish the association between the different factors (age, sex, height, weight, BMI, lipid profile, ALT, FBS, HbA1c, diabetes duration) and transient elastography findings of the diabetic patients with fatty liver on ultrasound that was tested at 0.05 level of significance.
Ethical considerations
Approval from the Institutional Ethics Committee was obtained before initiating the study. Consent from the different attending physicians was pursued concerning collection of vital information from the patients’ medical records. Patient identity and information gathered in the data collection forms were coded using letters and numbers to maintain confidentiality. Retrieval of Fibroscan with CAP results at an independent diagnostic center was accomplished by a consent letter addressed to the management. To maintain confidentiality, Fibroscan with CAP results were also tallied as coded numbers, each code representing a single patient. Privacy and confidentiality of data and results were protected in compliance with the Data Privacy Act.
We retrieved a total of 704 transient Fibroscan with CAP results in this study. Two hundred eighty-five patients were identified as having Type 2 diabetes mellitus. We came up with 164 patients eligible for the study after excluding 121 patients with diabetes with no fatty liver findings on ultrasound. Due to the high risk for metabolic and cardiovascular complications in patients with diabetes, as evidenced in several studies,[17],[22] we categorized patients in the ages <40 and ≥40 years old. Table 1 described the sociodemographic characteristics of the study population. Mean age was 57 years old. Mean duration of diabetes was 4 years. Mean weight and height were 71.43 kilograms and 1.61 meters, respectively. Majority (89%) of the patients aged at least 40 years old with both males and females equally represented. Most of them were overweight and obese (90%) and had diabetes duration of <5 years (62.8%). Table 2 described the laboratory results of the subjects. Mean FBS and ALT levels were 130 mg/dl and 38.27 IU/L, respectively. 59.76% of the population had high LDL-C levels. However, most had normal fasting blood sugar (58.54%), total cholesterol (60.37%), triglyceride level (60.37%), HDL-C (63.41%), HbA1c (81.1%) and ALT (54.27%).
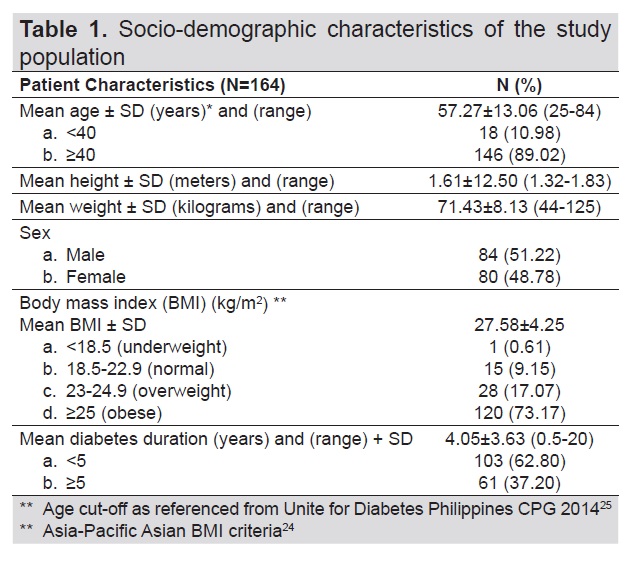
Table 1. Socio-demographic characteristics of the study population
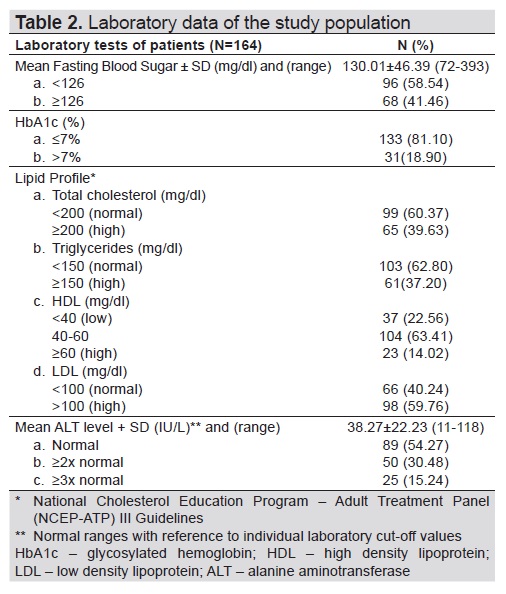
Table 2. Laboratory data of the study population
Around 55.5% of the patients had intermediate to advanced fibrosis and cirrhosis of the liver (Figure 2). Ninety six percent (96%) of the population had minimal to severe hepatic steatosis as documented on transient elastography with CAP (Figure 3). Note that only 44.5% and 3.66% of the subjects presented with minimal to no fibrosis, and no significant steatosis, respectively.
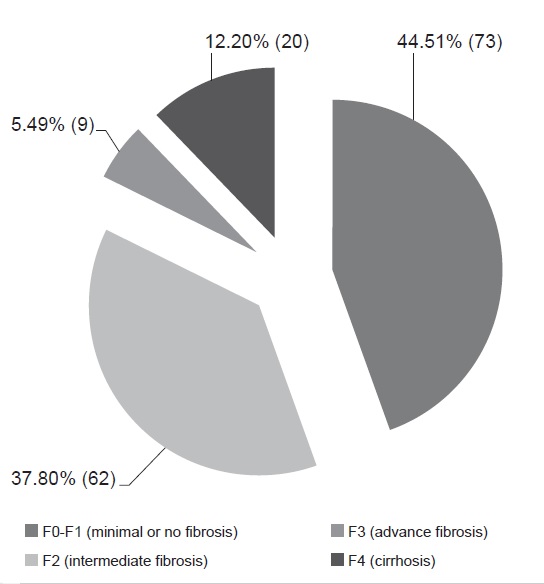
Figure 2. Liver stiffness measurement (LSM) data of patients (N=164).
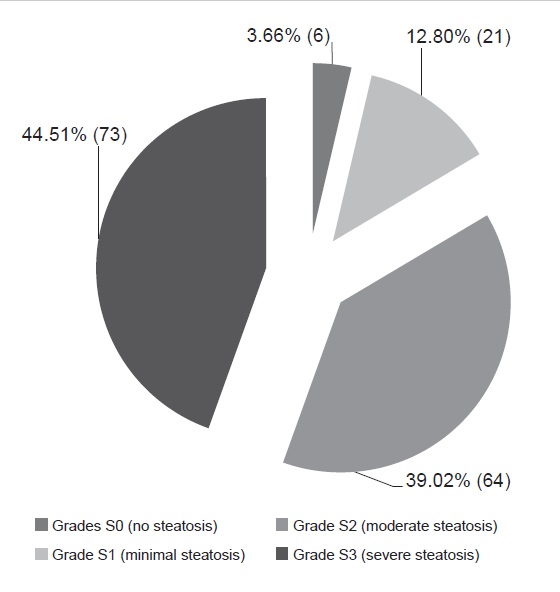
Figure 3. Controlled attenuation parameter (CAP) data of patients (N=164).
On Tables 3 and 4, the clinical characteristics of patients with fibrosis under LSM, and steatosis under CAP were outlined. 57.5% and 96.57% of the patients aged at least 40 years old had intermediate to advance fibrosis/cirrhosis on liver stiffness measurement, and mild to severe steatosis on controlled attenuation parameter, respectively. Note in the ages ≥40 years, 20 patients presented with cirrhosis (Table 4). There was a higher percentage of males with intermediate to advanced fibrosis and cirrhosis (52.7%) compared to females (47.3%) under LSM.
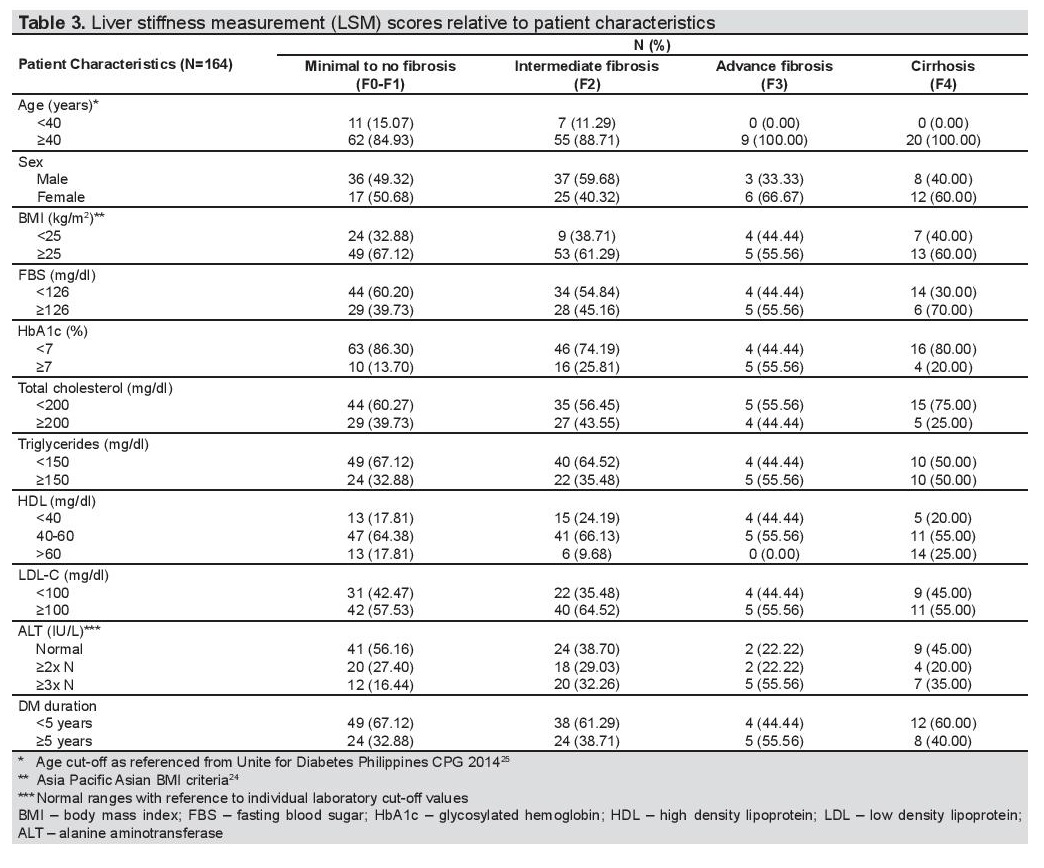
Table 3. Liver stiffness measurement (LSM) scores relative to patient characteristics
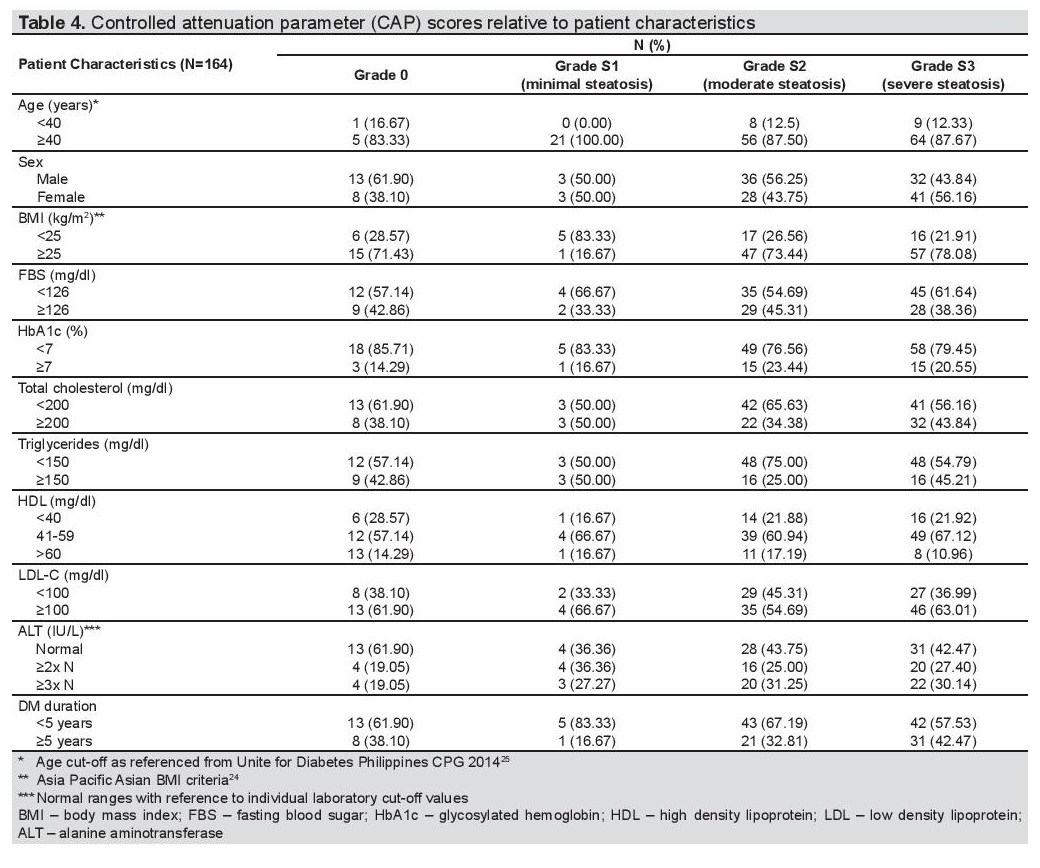
Table 4. Controlled attenuation parameter (CAP) scores relative to patient characteristics
However, under CAP measurement, there was negligible difference of having steatosis for both sexes (males 49.7% vs females 50.3%). Majority of the population who had higher degrees of fibrosis and steatosis had elevated BMI and LDL-C levels. SGPT levels were also above normal for patients with intermediate to advanced fibrosis/cirrhosis (59.3%) and mild to severe steatosis (55.9%). Majority had normal fasting blood sugar, glycated hemoglobin, total cholesterol and HDL-C levels. For both observations, diabetes duration was less than 5 years in most cases.
Logistic regression analysis was done to determine the association of the different variables in relation to the occurrence of liver fibrosis and cirrhosis in the study population (Table 5). A significant association was seen with duration of diabetes, HbA1c and ALT levels. There is 75% increase in the odds of having liver fibrosis and cirrhosis if diabetes duration was <5 years duration (OR 1.75, 95% CI 1.02-2.99, p=0.041), 125% increase in the odds of having liver fibrosis and cirrhosis if HbA1c levels ≥7% (OR 2.25, 95% CI 1.026-4.90, p=0.043) and 139% increase in the odds if SGPT ≥2-3x elevated from normal value (OR 2.389, 95% CI 1.46-3.93, p=0.001).
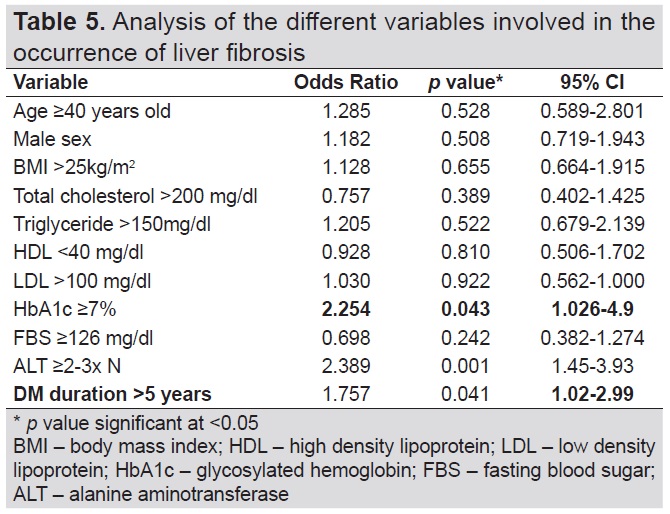
Table 5. Analysis of the different variables involved in the occurrence of liver fibrosis
Table 6 showed the variables involved in the occurrence of hepatic steatosis of the study group. Significant variables associated with the development of hepatic steatosis included BMI, HbA1c and triglyceride level. There is 31% increase in the odds that the patient will have a CAP score other than S0 if triglyceride levels >150 mg/dl (OR 1.31, 95% CI 0.647-2.59, p=0.0102) compared to those who have triglyceride levels <150 mg/dl. There is 45% increase in the odds that the patient will have a CAP score other than S0 if BMI >25k/m2 (OR 1.45, 95% CI 0.578-2.09, p=0.028) compared to those who have BMI <25kg/m2. There is 74% increase in the odds that the patient will have a CAP score other than S0 if HbA1c is ≥7% (OR 1.775, 95% CI 0.608-4.19, p=0.004) compared to those who have HbA1c <7%.
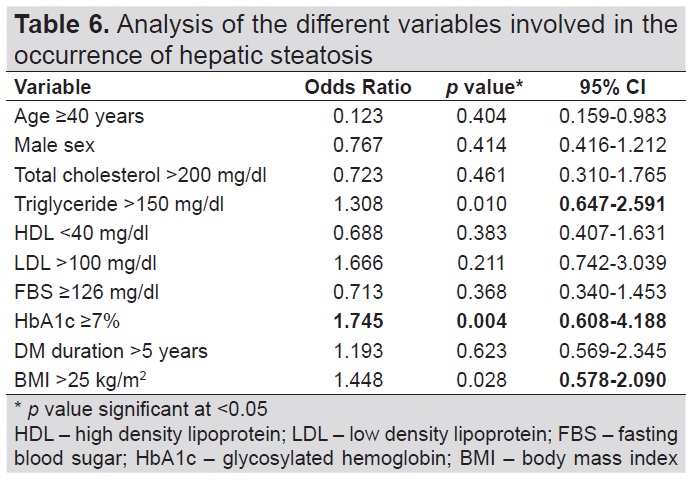
Table 6. Analysis of the different variables involved in the occurrence of hepatic steatosis
A Chi square test for independence was done to document the association of the demographic and clinical factors, and biochemical test results with the Fibroscan findings. In this study, the fatty liver findings on ultrasound was associated with significant CAP scores since p-value of the chi square test for independence was significant (p value=0.033, <alpha=0.05).
In our study, the prevalence of fatty liver documented on ultrasound among the type 2 diabetes mellitus population was 57.5% (164/285), higher than the results of the study of Prasetya et al.,[22] which was conducted among outpatient persons with Type 2 diabetes in Indonesia. This finding was in congruence with the rising number of patients with metabolic syndrome and/or Type 2 diabetes as reported in several epidemiological studies. Similar to the findings of Lesmana et al.[23] NAFLD was prevalent among age at least 40 years old. There was higher incidence of mild to severe hepatic steatosis (96%) when transient Fibroscan with CAP was utilized, a finding consistent with that of Grgurevic et al.,[26] In the study of Roulot et al.,[27] wherein 47 patients with LSM score of ≥8 kPa underwent liver biopsy, 93% had steatosis and 51% had severe fibrosis.
Most of the patients in this study had diabetes mellitus of at least 5 years, indicating that the process of NAFLD might be associated with disease duration. The available literature explained that the process of NAFLD might have occurred long before the diagnosis of Type 2 diabetes mellitus.[28] In our case, the odds of having fatty liver, in relation to diabetes duration, was increased when examined statistically, similar to the findings of Khan et al.[28]
Most of the patients in our study had high BMI. Reviewing the CAP scores of the subjects pointed out that varying degrees of hepatic steatosis (S1-S3) occurred in the overweight to obese population, along with elevated serum triglyceride levels. These findings were consistent with the reports of Trovato et al.[29] In a study by Leite et al.,[14] above normal ALT was associated with hepatic steatosis, however, glycemic control was not associated with the increased risk of NAFLD in patients with diabetes. On the contrary, our findings showed that poor glycemic control was a predictive risk factor for NAFLD. The contradicting results indicate that there are a lot of unidentified factors underlying NAFLD occurrence in patients with diabetes.
Our study found the prevalence of significant fibrosis and cirrhosis in 55.5% of patients with NAFLD. The rate was somewhat higher than the results from the study of Prasetya et al.[22] However, studies examining the degree of fibrosis in patients with NAFLD are still limited, probably, due to the mere fact that liver biopsy remains the gold standard for characterizing liver histological alterations in patients with NAFLD as outlined in the 2018 Clinical Practice Guidelines of the American Association for the Study of Liver Disease for the Diagnosis and Management of Nonalcoholic Fatty Liver Disease. Higher ALT levels, HbA1c >7% and disease duration of >5 years were associated with the occurrence of varying degrees of fibrosis in our study.
Strengths and limitations of the study
Our study had a greater number of recruited subjects compared to prior studies published. This is one of a few local studies done on determining the prevalence and incidence of NAFLD in type 2 diabetic patients along with its predisposing risk factors utilizing transient elastography with CAP. However, some limitations included: cross-sectional retrospective design, it cannot describe the total causality of the disease; single-center study, which may not represent the entire Filipino population. A major limitation was selection bias. The data collection process should have started with the clinic chart reviews of qualified type 2 diabetic subjects, then proceeding to retrieval of ultrasound results, thereafter, the Fibroscan readings. Since we wanted to maintain consistency of Fibroscan with CAP readings, we electronically retrieved the results beforehand in a single and independent diagnostic center with the procedure done by a single, well-trained operator. In this way, we were able to avoid inter-observer variability of data which may affect the study results.
Recommendations
Larger studies for longer periods of time are needed to firmly establish the validity of this study results. Multicenter studies are highly recommended. Further studies are also recommended to determine the sensitivity and specificity of Fibroscan with CAP as a screening tool for identifying hepatic steatosis and fibrosis among patients with NAFLD.
The prevalence of fatty liver among patients with Type 2 diabetes on ultrasound in this study was 57% (164/285). Majority of patients with fatty liver on ultrasound had confirmed hepatic steatosis on Fibroscan with CAP, with the prevalence of 96% (158/164). Controlled attenuation parameter scores were associated with the occurrence of varying degrees of steatosis. Factors associated with hepatic steatosis included above normal BMI, HbA1c ≥7% and serum triglycerides.
The prevalence of hepatic fibrosis and cirrhosis, when examined under Fibroscan with CAP, among patients with fatty liver on ultrasound, was 55.5% (91/164). Factors associated with the development of liver fibrosis and cirrhosis were elevated ALT, glycosylated hemoglobin ≥7% and ≥5 years duration of diabetes.
Findings in the liver stiffness measurement were independent of the findings of controlled attenuation parameter when using transient elastography with CAP in detecting NAFLD among patients with Type 2 diabetes. Given the above findings, factors associated with the severity of hepatic fibrosis, cirrhosis and steatosis included above normal BMI, disease duration of ≥5 years, poor glycemic control and elevated levels of ALT, and serum triglycerides.
Statement of AuthorshipAll authors certified fulfillment of ICMJE authorship criteria.
Author DisclosureThe authors declared no conflict of interest
Funding SourceNone.
[1] Chalasani Naga, Younossi Z, Lavine JE, et al. The diagnosis and
management of nonalcoholic fatty liver disease: Practice guidance from
the American Association for the study of liver diseases. Hepatology.
2018;67(1):328-57.
[2] Cortés C. Hígado graso no alcohólico: Manifestación hepática del
síndrome metabólico. Medicina Familiar.
[3] Teli MR, James OF, Burt AD, Bennett MK, Day CP. The natural
history of nonalcoholic fatty liver: A follow‐up study. Hepatology.
1995;22(6):1714-9.
[4] Matteoni CA, Younossi ZM, Gramlich T, Boparai M, Liu YC,
McCullough AJ. Nonalcoholic fatty liver disease: A spectrum of clinical
and pathological severity. Gastroenterology.1999;116(6):1413-9.
[5] Dam-Larsen S, Franzmann M, Andersen IB, et al. Long term
prognosis of fatty liver: Risk of chronic liver disease and death. Gut.
2004;53(5):750-5.
[6] Ekstedt M, Franzén LE, Mathiesen UL, et al. Long‐term follow‐up
of patients with NAFLD and elevated liver enzymes. Hepatology.
2006;44(4):865-73.
[7] Wanless IR, Lentz JS. Fatty liver hepatitis (steatohepatitis) and obesity:
an autopsy study with analysis of risk factors. Hepatology. 1990;12(5):
1106-10.
[8] Williams CD, Stengel J, Asike MI, et al. Prevalence of nonalcoholic fatty
liver disease and nonalcoholic steatohepatitis among a largely middleaged
population utilizing ultrasound and liver biopsy: A prospective
study. Gastroenterology. 2011;140(1):124-31.
[9] Levin KE, Galante M, Clark OH. Parathyroid carcinoma versus
parathyroid adenoma in patients with profound hypercalcemia.
Surgery. 1987;101(6):649-60.
[10] Fassio E, Alvarez E, Domínguez N, Landeira G, Longo C. Natural
history of nonalcoholic steatohepatitis: A longitudinal study of
repeat liver biopsies. Hepatology. 2004;40(4):820-6.
[11] Adams LA, Sanderson S, Lindor KD, Angulo P. The histological
course of nonalcoholic fatty liver disease: A longitudinal study of 103
patients with sequential liver biopsies. J Hepatol. 2005;42(1):132-8.
Younossi ZM1, Gramlich T, Matteoni CA, Boparai N, McCullough
AJ. Nonalcoholic fatty liver disease in patients with type 2 diabetes.
Clin Gastroenterol Hepatol. 2004;2(3):262-5
[13] Vernon G, Baranova A, Younossi ZM. Systematic review: The
epidemiology and natural history of non‐alcoholic fatty liver
disease and non‐alcoholic steatohepatitis in adults. Aliment Pharmacol
Ther. 2011;34(3):274-85.
[14] Leite NC, Salles GF, Araujo AL, Villela-Nogueira CA, Cardoso CR.
Prevalence and associated factors of non‐alcoholic fatty liver disease
in patients with type‐2 diabetes mellitus. Liver Int. 2009;29(1):113-9.
[15] Prashanth M, Ganesh HK, Vima MV, et al. Prevalence of nonalcoholic
fatty liver disease in patients with type 2 diabetes mellitus. J Assoc
Physicians India. 2009;57:205-10.
[16] European Association for the Study of the Liver (EASL); European
Association for the Study of Diabetes (EASD); European Association
for the Study of Obesity (EASO). EASL-EASD-EASO Clinical
Practice Guidelines for the management of non-alcoholic fatty
liver disease. Obes Facts. 2016;9(2):65-90.
[17] Bril F, Cusi K. Management of nonalcoholic fatty liver disease
in patients with type 2 diabetes: A call to action. Diabetes Care.
2017;40(3):419-30.
[18] Wong VW, Vergniol J, Wong GL, et al. Diagnosis of fibrosis and
cirrhosis using liver stiffness measurement in nonalcoholic fatty liver
disease. Hepatology. 2010;51(2):454-62.
[19] Fraquelli M, Rigamonte C, Casazza G, et al. Reproducibility of
transient elastography in the evaluation of liver fibrosis in patients
with chronic liver disease. Gut. 2007;56(7):968-73.
[20] Musso G, Gambino R, Cassader M, Pagano G. Meta-analysis: Natural
history of non-alcoholic fatty liver disease (NAFLD) and diagnostic
accuracy of non-invasive tests for liver disease severity. Ann Med.
2011;43(8):617-49.
[21] Sasso M, Miette V, Sandrin L, Beaugrand M. The controlled attenuation
parameter (CAP): A novel tool for the non-invasive evaluation of
steatosis using Fibroscan. Clin Res Hepatol Gastroenterol. 2012;36(1):
13-20.
[22] Prasetya IB, Hasan I, Wisnu W, Rumende CM. Prevalence and
profile of fibrosis in diabetic patients with non-alcoholic fatty liver
disease and the associated factors. Acta Med Indones. 2017;49(2):91-8.
[23] Lesmana CR, Pakasi LS, Inggriani S, Aidawati M, Lesmana LA.
Development of non-alcoholic fatty liver disease scoring system among adult medical check-up patients: A large cross-sectional and
prospective validation study. Diabetes Metab Syndr Obes. 2015;8:213-
8.
[24] Lim JU, Lee JH, Kim JS, et al. Comparison of World Health Organization
and Asia-Pacific body mass index classifications in COPD patients. Int
J Chron Obstruct Pulmon Dis. 2017;12: 2465-75.
[25] Jimeno C. A summary of the Philippines UNITE for iabetes clinical
practice guidelines for the diagnosis and management of diabetes
(Part I: Screening and diagnosis of DM). J ASEAN Fed Endocr Soc.
2011;26(1):26-30.
[26] Grgurevic I, Bokun T, Mustapic S, et al. Prevalence of fatty liver and
fibrosis in patients with type 2 diabetes mellitus and previously
undetected liver disease as assessed by transient elastography and
ultrasound. J Hepatol. 2017;66(1):S661.
CrossRef
[27] Roulot D, Roudot-Thoraval F, NKontchou G, et al. Concomitant
screening for liver fibrosis and steatosis in French type 2 diabetic
patients using Fibroscan. Liver Int. 2017;37(12): 1897-1906.
[28] Wang RT, Koretz RL, Yee HF Jr. Is weight reduction an effective
therapy for nonalcoholic fatty liver? A systematic review. Am J Med.
2003;115(7):554-9.
[29] Trovato FM., et al. Neglected features of lifestyle: Their relevance in
non-alcoholic fatty liver disease. World J Hepatol. 2016;8(33):1459-65.
PubMed PubMed Central CrossRef
Authors are required to accomplish, sign and submit scanned copies of the JAFES Author Form consisting of: (1) Authorship Certification, that all the requirements for authorship have been met by each author, and that the final version of the manuscript has been read and approved by all authors; (2) the Author Declaration, that the article represents original material that is not being considered for publication or has not been published or accepted for publication elsewhere; (3) the Statement of Copyright Transfer [accepted manuscripts become the permanent property of the JAFES and are licensed with an Attribution-Share Alike-Non-Commercial Creative Commons License. Articles may be shared and adapted for non-commercial purposes as long as they are properly cited]; and the ICMJE form for Disclosure of Potential Conflicts of Interest. For original articles, authors are required to submit a scanned copy of the Ethics Review Approval of their research as well as registration in trial registries as appropriate. For manuscripts reporting data from studies involving animals, authors are required to submit a scanned copy of the Institutional Animal Care and Use Committee approval. For Case Reports or Series, and Images in Endocrinology, consent forms, are required for the publication of information about patients; otherwise, appropriate ethical clearance has been obtained from the institutional review board. Articles and any other material published in the JAFES represent the work of the author(s) and should not be construed to reflect the opinions of the Editors or the Publisher.